Hindenburg Omen Signaled, But Also Not
 Thursday August 12, 2010 was a Hindenburg Omen day, and it also was not. There is a rules conflict which does not matter very often, but matters this time.
You can get an overview of what this signal is about at wikipedia.org/wiki/Hindenburg_Omen. It has been updated quite a bit since the last time I visited that page, so it is clear that somebody cares to make posts there to update it, including mention of the signal that occurred on Aug. 12. The key history is that this signal was developed by Jim Miekka, who is a blind mathematician who for years wrote and published The Sudbury Bull and Bear Report. I do not know if he is still doing that.
The ominous sounding name of this signal comes from the late Kennedy Gammage, who passed away Jan. 3, 2006, just a few months after he retired from writing The Richland Report newsletter. Ken was one of the great proponents of the McClellan Oscillator and Summation Index, and was a big reason why they came to be so well known. The McClellan Oscillator being positive or negative is one of the criteria for a Hindenburg Omen, so it was probably out of working with that indicator that Miekka came into contact with Ken Gammage. I suspect that the idea for the name "Hindenburg" was related to a similar signal using NH and NL called the "Titanic Syndrome" which was developed by the late Bill Ohama.
The Wikipedia article contains an early set of criteria for the HO:
- Both New Highs (NH) and New Lows (NL) must exceed 2.2% of total NYSE issues on the same day.
- The smaller of these must be greater than or equal to 69 (note: the Wikipedia rules used to say 79, which was more than 2.2% of total NYSE issues for most of history).
- The 10-week MA of the NYSE Comp (NYA) is rising (i.e. market is in an uptrend, which is important since you don't need an omen that a downtrend might be coming if you are already in a downtrend).
- McClellan Oscillator is negative.
- NH cannot be more than 2x NL.
On Aug. 12, NH was 92, and NL was 81. So HO criteria were met per the Wikipedia set of rules.
But when Greg Morris was writing my favorite book on market breadth indicators, he contacted Miekka to get the straight story. Miekka originally took this up as a means of improving something that Gerald Appel created years before, which he called his "Split Market Sell Signal". That signal simply looked for instances when both NH & NL exceeded 45, with no adjustment for inflation in the number of issues, and no McClellan Oscillator validation rule.
The criteria that Miekka provided are different from the ones listed in Wikipedia, likely due to refinements that Miekka made:
- Both NH and NL must exceed 2.8% of the sum of Advances plus Declines (unchanged issues ignored) on the same day.
- The NYSE Comp (NYA) must be above its value of 50 trading days ago (a conversion from a weekly MA rule to a rule befitting daily data).
- Once initiated, the signal is valid for 30 trading days, and any additional HO signals during those 30 TD should be ignored.
- The signal is activated (i.e. go short) whenever the McClellan Oscillator is negative, and deactivated whenever the McClellan Oscillator is positive (within the 30 TD window).
The total of Advances plus Declines (per WSJ) on August 12 was 3063. 2.8% of that is 85.76, so to trigger the rule we would need to see both NH and NL at 86 or higher. Because NL was only 81, it did not meet this criterion (this is where we cue TV secret agent Maxwell Smart saying, "Missed it by THAT much.")
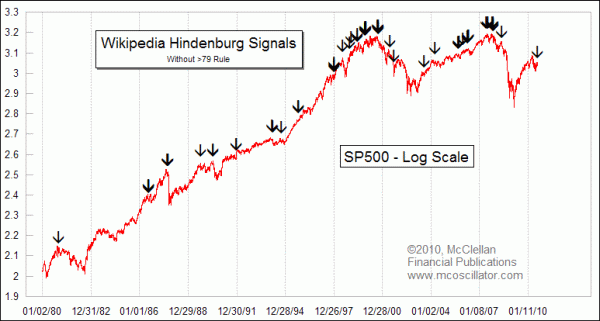
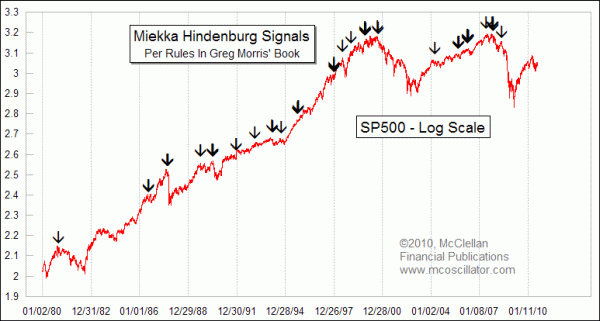
Below are two charts that highlight when the signals are given according to each set of rules. There is a lot of overlap, but slightly fewer false signals using Miekka's updated rules. For the purposes of this chart, I omitted the "both >79" rule, since it is duplicative of the 2.2% rule most of the time, and unnecessarily filters out earlier signals at the left end of the chart when the total number of issues was smaller.


One notable difference between the two charts is that the Wikipedia rules triggered an HO signal on Sep. 17, 2001, which was the day that the NYSE reopened after the 9/11 attacks. We did not really need an omen that day to know there was trouble. One reason why that day was able to create a signal was that the 10-week SMA of the NYSE Comp was still rising (barely). The newer version of that rule (NYA above value of 50 days ago) is arguably better for this instance, and perhaps others.
One other point worth noting is that these charts only go back to 1980. In 1979, the rules were changed for measuring and counting NH and NL. In the old days of ticker tapes and chalk quote boards, people did not have the information processing capabilities we enjoy today. So tabulation of NH and NL were done on a calendar year basis rather than a rolling 52-week basis. But since every stock would make a NH or NL on the first trading day of a new calendar year, the tabulators would use the prior calendar year's records for each stock's NH and NL until sometime around April. Then they would drop the old year's records and use the new year's records for highest and lowest prices for each stock to tabulate when any stocks made new highs or new lows. So rather than a consistent 52-week lookback period, it would range from 4 months to 16 months depending on where you were in the calendar year.
I cannot really blame them; it would have been a huge statistical undertaking to keep track of all of that data. But the important point is that NH/NL data prior to 1979 were tabulated in a much different manner than how we do it today, so using the older data can be problematic for any type of systematic analysis of what the numbers mean.
Tom McClellan
Editor, The McClellan Market Report