The Intersection of Stock Market & Political Races
Back in 2000, we first began exploring the relationship between polling data in the presidential election and the movements of the stock market. That relationship continues now as it did then, with the incumbent party benefiting when the stock market goes up, and suffering after it goes down.
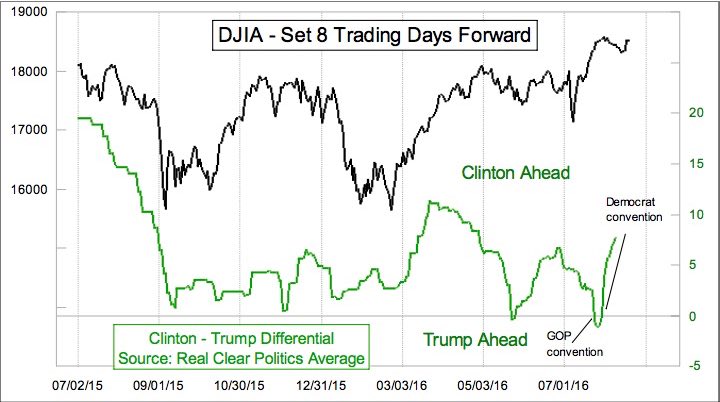
We can see that relationship in the top chart , which features the Real Clear Politics average of multiple polls. We have shifted forward the plot of the DJIA by 8 trading days to reveal how the polling data follow the market with about that much of a lag.
One point to understand is that polls naturally vary. That does not make them inaccurate; the public is fickle and people change their minds frequently. But any poll is going to be imperfect in measuring those changes because of the inherent lags involved with asking people their opinions, tabulating those data, and then reporting it.
Real Clear Politics adds an additional lag because of averaging together several polls dating back a few days. So the emotional changes which the stock market can more immediately portray take longer to show up in the reported polling numbers.
Also adding a curve ball to the response in the top chart is that the Republican and Democratic national conventions tend to focus on one candidate and then the other, magnifying the poll numbers in each direction. We have seen that effect to a large degree now in 2016.

Back in 2000, the Republican and Democratic conventions were nicely aligned with a dip and a rally in the DJIA. So there was no noticeable difference in the way that the poll numbers moved in favor of the incumbent (Gore) after an up move by the stock market. The decline into October 2000 led to surge for George W. Bush, with Gallup’s poll differential peaking at 13 percentage points about a week after the DJIA hit its bottom.
As of the Thursday ahead of the Nov. 7, 2000 vote, Bush was still up by 6 percentage points, but we wrote in this newsletter that the actual election results would be “too close to call”. That ended up being one of our best forecasts ever. We had noticed the rebound by stock prices, and expected that it would lead to a corresponding change for the poll numbers. As it turned out, the 2000 election was indeed too close to call for about 6 weeks.

In 2004, the poll numbers just ahead of the actual election showed a tie between Bush and Kerry, but we confidently predicted a Bush victory. Once again, the stock market gave us an answer ahead of time, and so while the political pundits were all scratching their heads about how the pre-election polls could have been “wrong”, we knew that the stock market’s rebound had not yet been reflected in the polling data. Bush ended up winning the popular vote by 3 percentage points, showing a nice correlation to what the DJIA had said should happen.
By 2008, technology had allowed the polling companies to start daily polling leading up to the election. And there was also the ability to differentiate between all persons, registered voters, and “likely” voters.
There was no actual incumbent in 2008 due to term limits, but Sen. McCain wore that mantle by virtue of being in the party of the sitting president. Stock prices saw a plateau peak in late August 2008 and then started to slide in a big way. The poll numbers shifted accordingly, leading to a spread as big as 13 points among registered voters just ahead of the election.

The DJIA did make a bottom on Oct. 27, 2008, just a week before the election, and it also saw a big rebound. But it was not enough of a rebound to lift John McCain in the polls. Pundits marveled at how the polls showed a much bigger margin for then-Senator Obama than the actual vote, believing that people must have been lying to the pollsters. But those pundits did not understand how a rebound in stock prices would bring a change to the public’s mood, or perhaps better stated that it would reflect a change in the public’s mood. Perhaps if the election had been even another week later, it might have been closer.
The 2012 election got a lot more complicated. The first complication was that the incumbent and challenger switched from their normal roles in terms of following the movements of the stock market. Price rises tended to result in improvements for Mitt Romney, and declines tended to favor President Obama, after factoring in the normal polling response lag. The second complication was that Hurricane Sandy hit the eastern seaboard, including New York City. It did not matter that Sandy had been downgraded to just a tropical storm as of the time when it hit. Coinciding with a high tide meant extreme flooding of lower Manhattan, and shut down the stock market for 2 days. It also shut down polling.

By the time the market reopened, selling pressure led to a pretty big drop in stock prices, and the polling showed a pretty big swing from what had been a big lead for Romney into a victory for Obama. The market was right, but it was really hard to read at the time.

Turning back to the current time frame, Gallup has left the presidential polling game. A multitude of others have taken over, some with dubious data quality. The final chart looks at just 2 polling firms, and the effect is clearly seen. Trump’s favorability peaked just after the Brexit vote, and he stock market’s rebound since then has favored the incumbent party’s candidate, Mrs. Clinton. The curious conclusion from this is that if one favors Mr. Trump in the election, he should hope for a stock market decline.
We'll continue to monitor and report on this as November draws near.