50 Years Since Creation of the McClellan Oscillator
Free Chart In Focus email
Delivered to you every week
It was 50 years ago in 1969 that my parents created what later became known as the McClellan Oscillator. So this week, I thought I would share a little bit of that history, and offer a look at how it was done back then.
My father Sherman McClellan is still alive and doing well at age 84, and I get the privilege of collaborating with him every day on our McClellan Market Report newsletter and our Daily Edition. My mother Marian McClellan passed away from cancer in 2003. The important part of this particular story is that the early work that they did required the talents of both of them to accomplish.
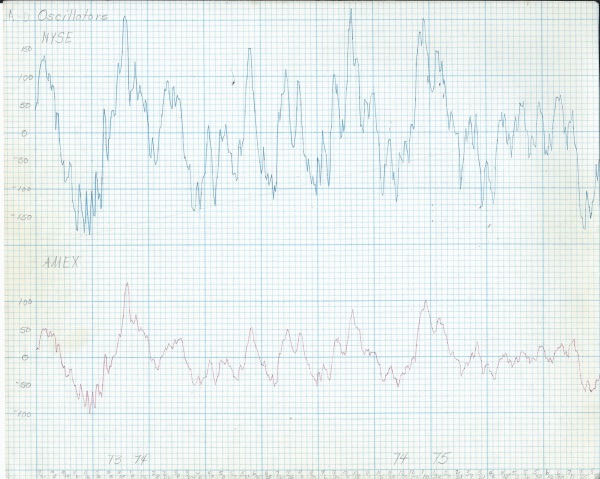
When I was visiting my father last Christmas, my sister Betsy presented me with an old folder she thought I might want, something she had come across while going through our mother’s files and papers recently. This week’s chart was included in that trove, and it features a hand drawn plot of the NYSE’s McClellan A-D Oscillator on top. The same indicator for the American Stock Exchange (AMEX) is on the bottom. The chart spans a period from late 1973 through mid-1975.
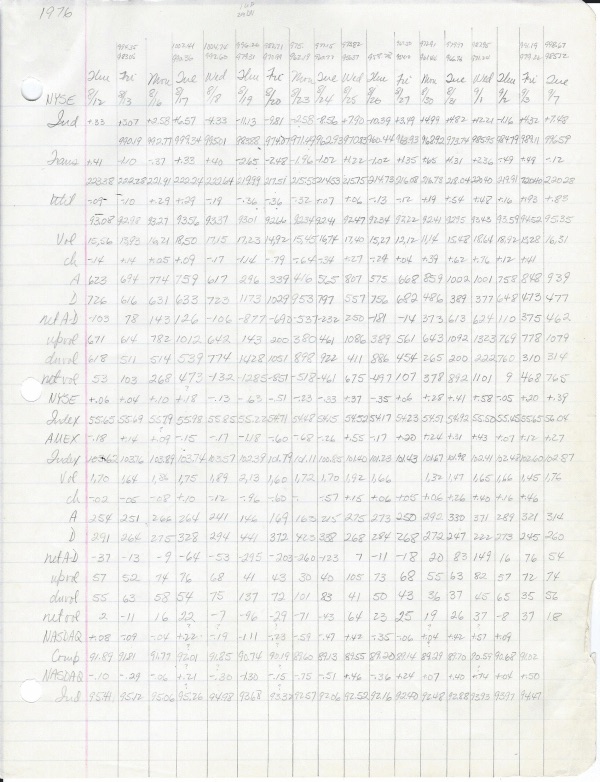
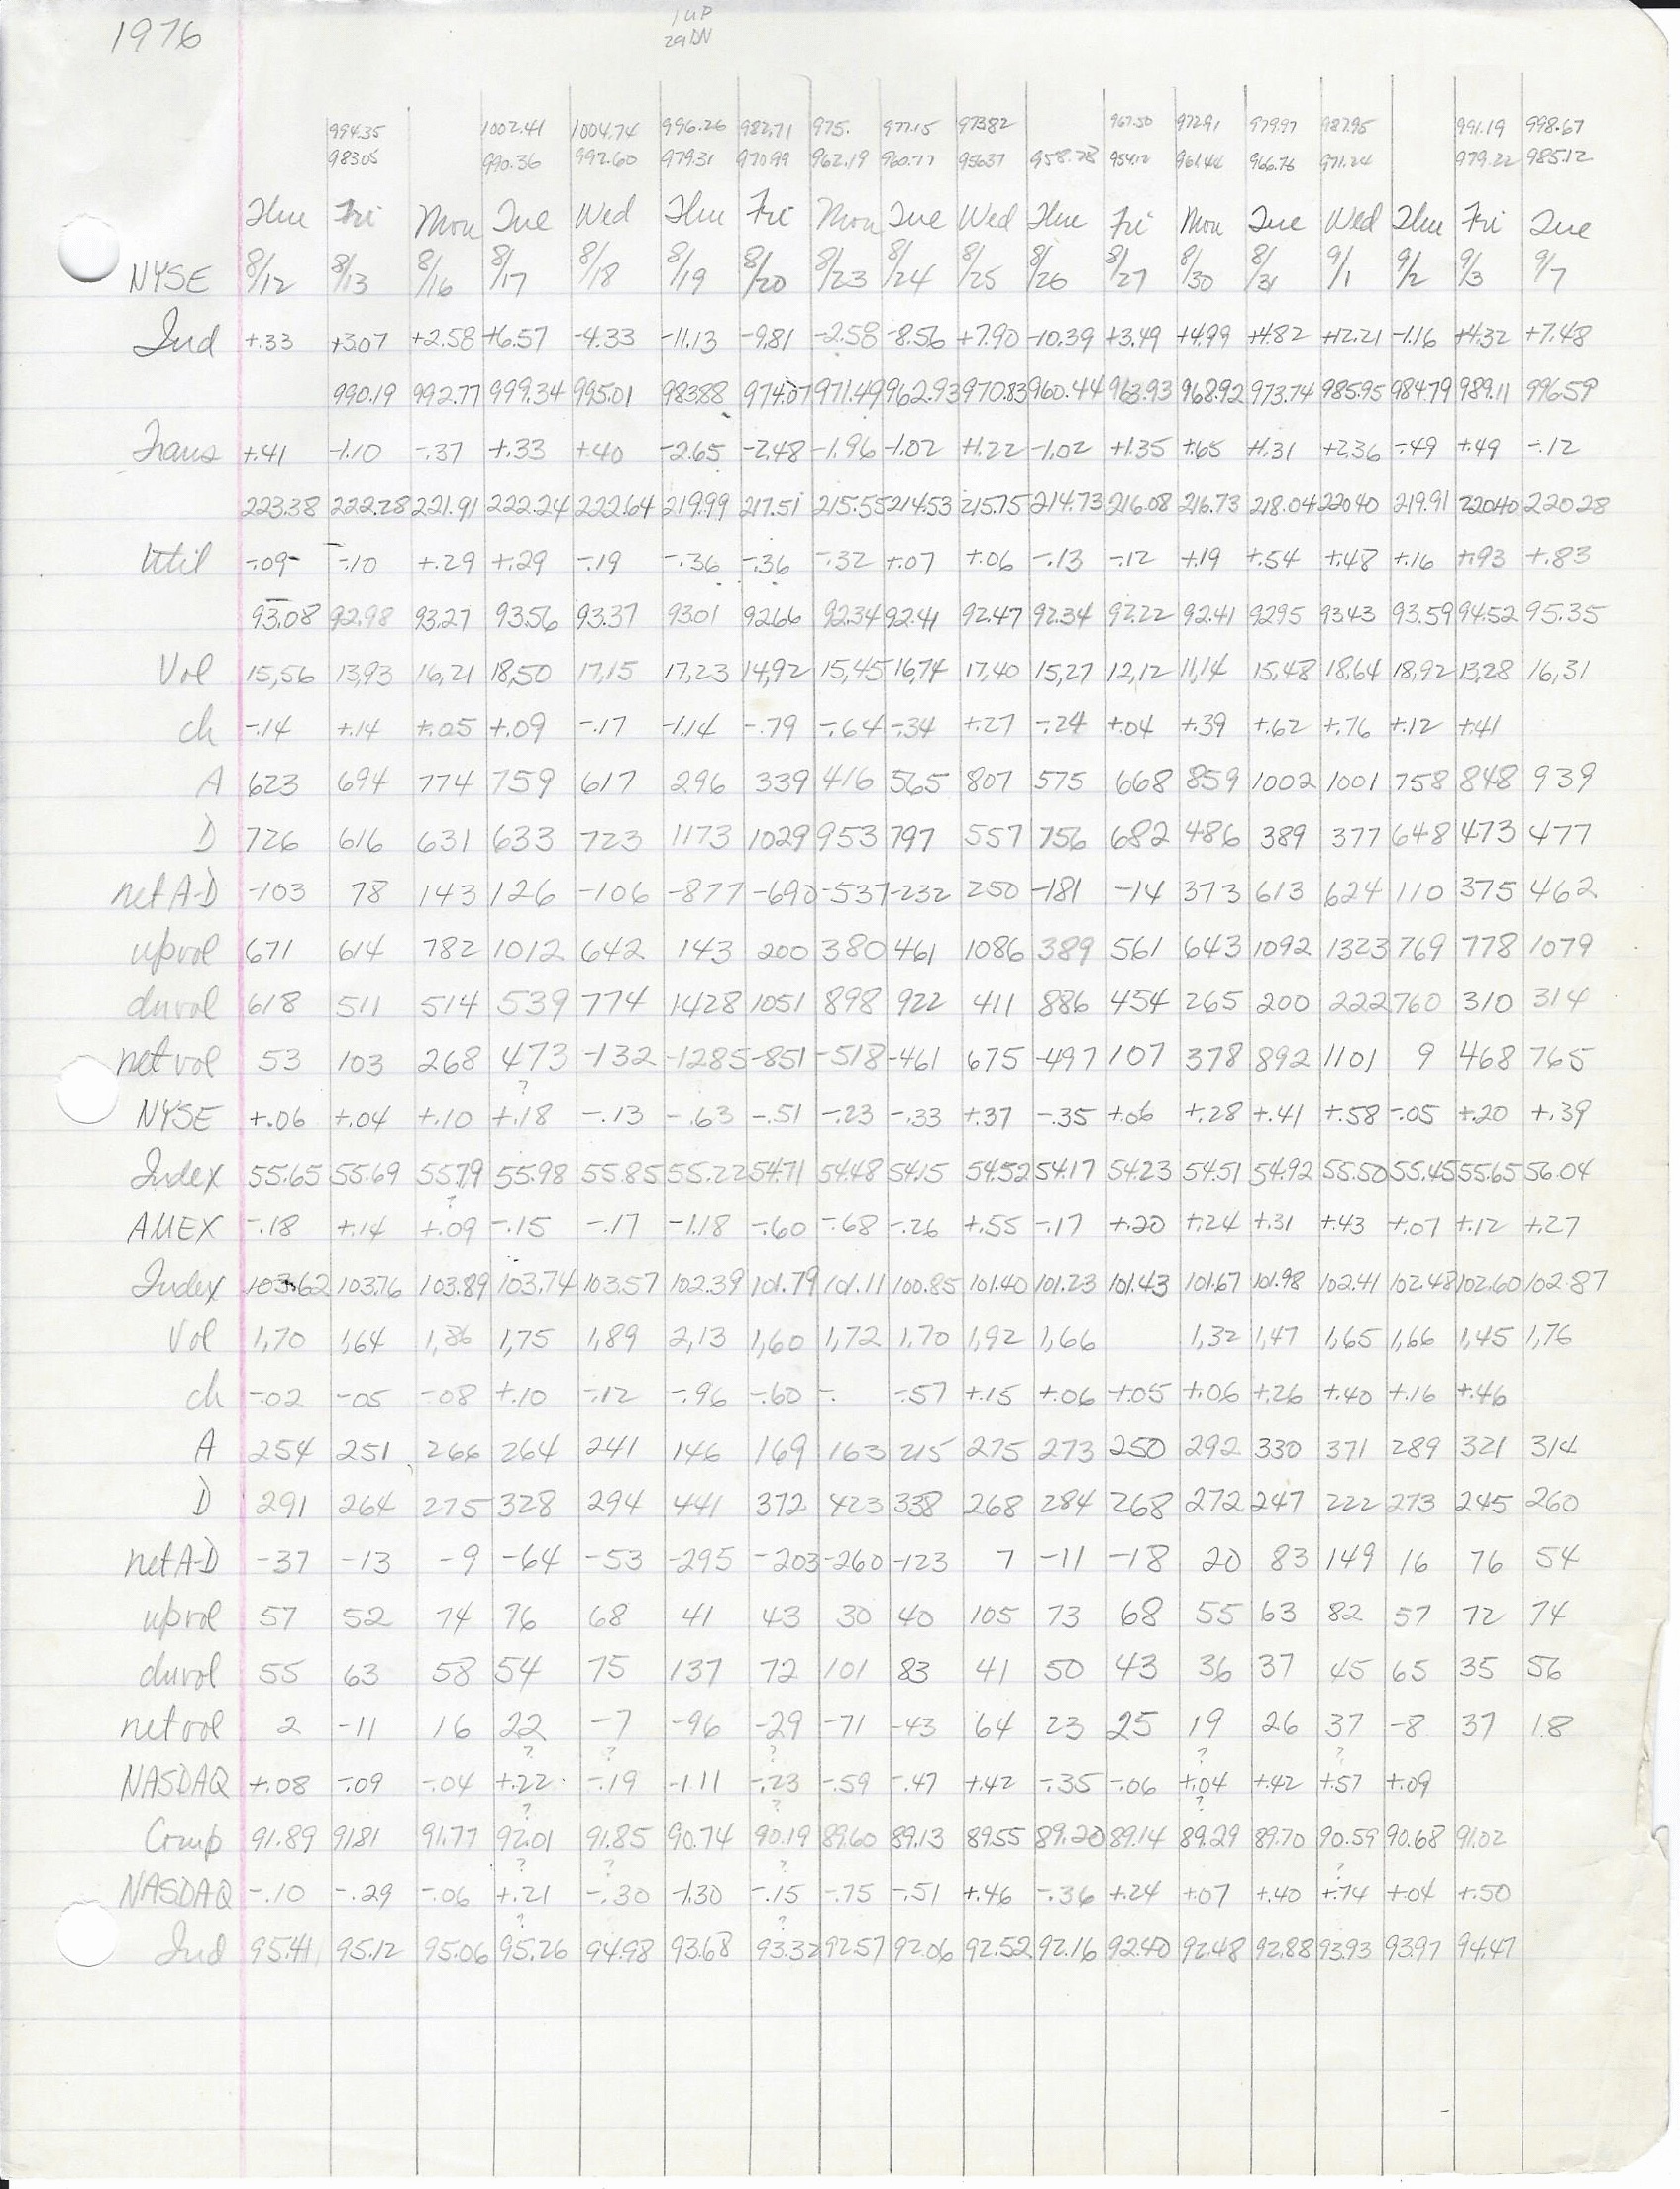
To create these plots, my parents had to first gather the daily values for Advances and Declines and other data, which were published in the newspaper, and which they kept on a ledger like this one that was also in the trove of papers:
 (link to larger image)
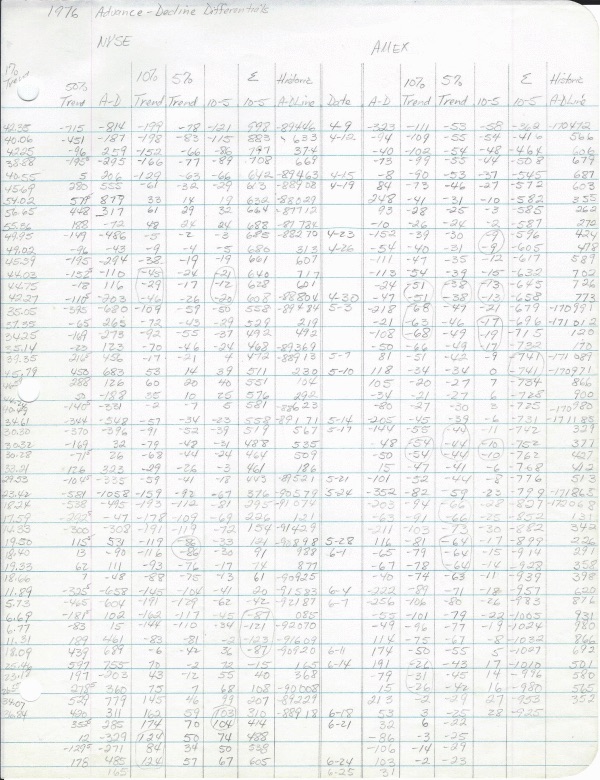
My mother had been a math major in college, and so she was responsible for doing most of the calculations of the 10% Trend and 5% Trend of daily A-D numbers. The McClellan Oscillator is the difference between those two EMAs. So separate calculation columns for each of those items had to be tallied and maintained. Here is a copy of one of those calculation ledgers from 1976, all in her handwriting:
 (link to larger image)
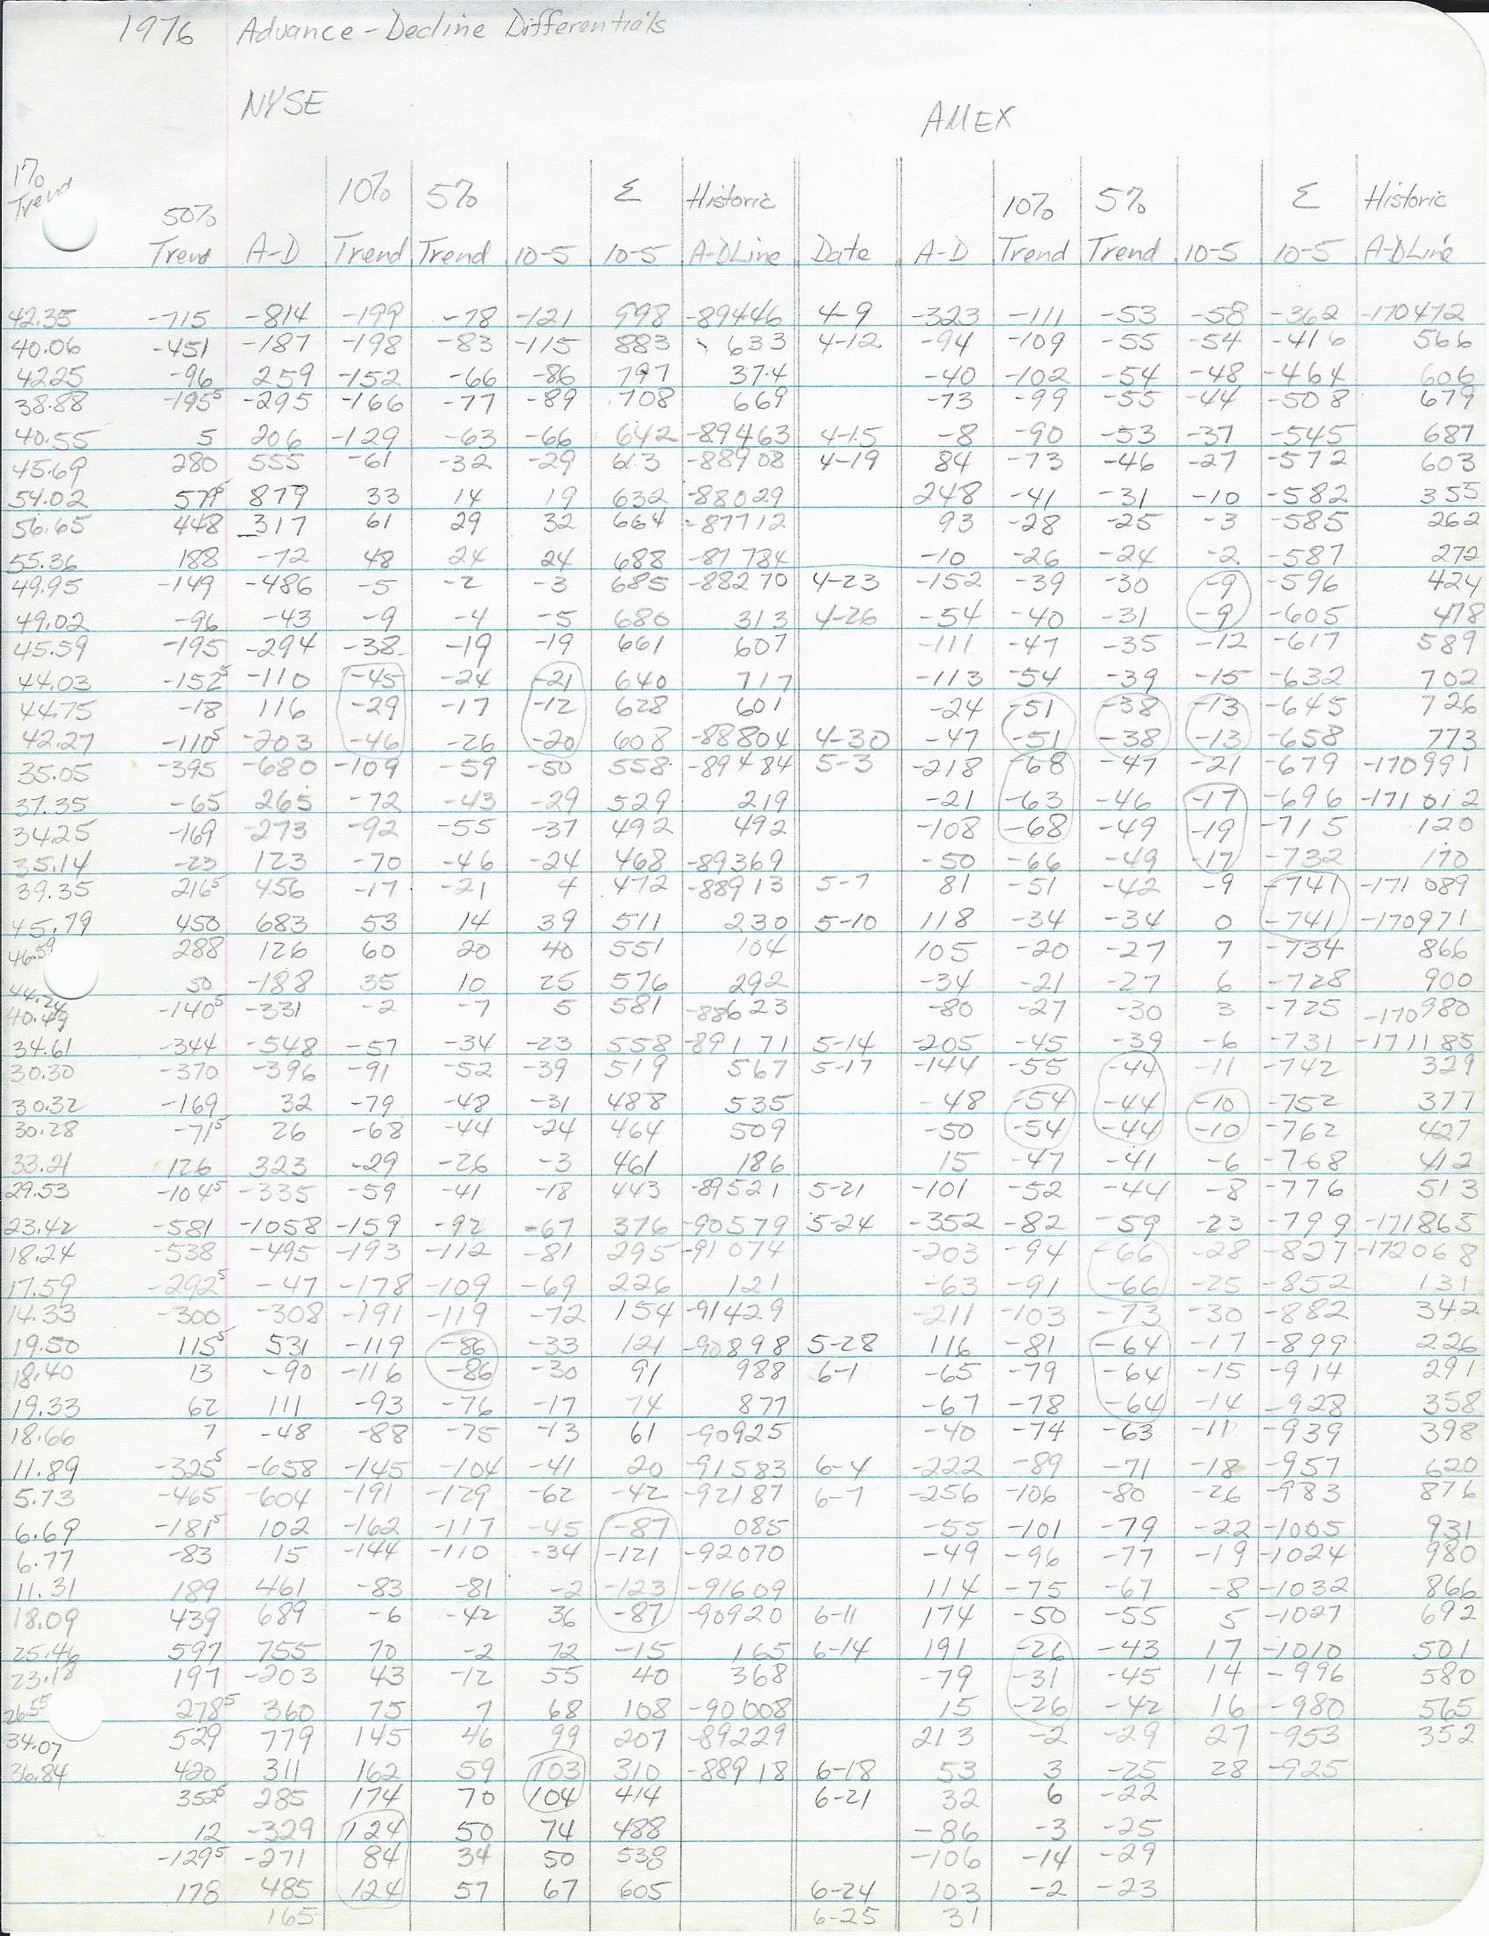
Once the calculations were done, and again this was all manually calculated, then they could be plotted by hand on graph paper to create charts like the one above. When a chart like that was first being set up, a chartist had to hope that a proper scaling was selected, so that the future values that would get posted on the chart would fit into that scaling. Occasionally, and especially on stock price charts, the plot would wander above or below the edge of the page, and so an extra segment of graph paper would have to get taped to the edge of the paper in order to allow the plot to wander beyond that paper limit.
My mother had been one of only four female math majors at Pomona College, graduating in 1956. It was not fashionable for women to pursue mathematics as a course of study back then, but that was where her talent and abilities were. My father was a business and economics major at nearby Claremont Men’s College, or CMC. It is now known as Claremont McKenna College, a name change which came about following the admission of women. The two of them met at a square dance at Pomona College in their freshman year. He graduated two years behind her, due to a stint in the Army, and they married right after his 2 years in the Army were done, but before he had finished college.
My mother’s first jobs after college were working as a “computer”. Back then, that was an actual occupational title, as described in the movie Hidden Figures, about the early years of the space program. In trying to remember all of the family stories of these events, I asked my father Sherman for some clarification, and here is what he wrote:
Marian worked at RAND Corporation a couple of summers while in college. One project involved placing over 10,000 zeros into data in the correct places so that a program could run properly. She was working as a computer at the Jet Propulsion Laboratory (JPL) in Pasadena, CA between college graduation and just before our marriage. She quit that job, as the commute from Claremont was more than she wanted to tackle. After we were married on April 6, 1957 and moved to Claremont, she found the Norco job [at the Naval Ordnance Research Company]. Norco had electrical analog computers rather than digital computers for calculating rocket trajectories. She was a digital computer, if I understand correctly [to validate what the computers were putting out].
She quit that job when I graduated from CMC. In February or March 1958 we took delivery of the new Volkswagen BUG and got rid of the 1950 Chevy. After graduation we spent most of a couple months driving around the country visiting relatives and friends. Finance jobs were not available due to the 1958 recession; 25% of the Customers’ Men (as salesmen were called) working for brokerage companies were laid off that year. So I went back to school, attending Cal Poly San Luis Obispo for 2 quarters before getting a job with Waste King Corporation in 1959. Betsy was in a crib and Marian tutored other students in math while we lived in an apartment on the second floor in SLO. I got some help from her with calculus. Learning to operate a lathe, drill press, build a radio, welding, household electricity, some industrial engineering were all very useful in later projects.
Between the time in 1969 that Charting The Market featured the McClellan Oscillator and the publication of Patterns for Profit in 1970, we got data for two 4 year market cycles (for before the 1/1/68 Barron’s data that we had). Gene Morgan was very helpful in getting that data, providing books with that data. This allowed us to understand how the Oscillator and Summation Index behaved in bull and bear markets. Marian calculated all that data by hand.
The reference to the Charting The Market TV show concerns a half hour program that ran on KWHY-TV in Los Angeles, the first business news television station. It was a predecessor to WCIU in Chicago, FNN, CNBC, and others. It was a local UHF TV station, Channel 22, and Gene Morgan hosted the show which involved Gene going over several charts which were of interest after the stock market closed. Back then, all of the charts were of course hand-plotted. Gene was the one who came up with the name “McClellan Oscillator” to refer to the indicator that my parents had developed, and which my father introduced to the public in several appearances on that show.
One of the sponsors of that show was The Trade Levels Report, a stock market newsletter published by the late P.N. (Pete) Haurlan. He was an actual rocket scientist at JPL and who was interested in the stock market on the side, and later took that up as his sole profession. Haurlan was the one who had first introduced the use of exponential moving averages (EMAs) for tracking stock prices. It was a bit of math he had used in the rocketry work, where it was very useful in analog circuits.
If you calculate a 50-period simple moving average, you have to know the values of the data in all 50 of those included data points. But for an EMA, you only need to know the next raw data point and the last value of the EMA. The difference between those two is multiplied by the smoothing constant, e.g. 10% or 5%, to calculate how far the EMA moves on the next EMA value. So an indicator which only requires 2 inputs is a whole lot easier to design into an analog circuit.
In Haurlan’s newsletter, he had featured calculations and chart plots of individual EMAs for both prices and for the Advance-Decline difference. The big insight that my parents had in 1969 was to look at the difference between two EMAs, which eventually came to be known as the McClellan Oscillator. In an interesting bit of serendipity, 1969 was also the year that Gerald Appel created what became known as MACD, or Moving Average Convergence-Divergence. These simultaneous discoveries occurred with them 3000 miles apart, and unknown at the time to each other.
Haurlan was also the first person to use a computer for technical analysis, because he had access to a room-sized one at JPL. He would encode the data he was interested in onto IBM cards (remember those “hanging chads”?) and then run them in the off hours when the computer was not busy doing space and rocketry stuff.
My parents had been tinkering around a little bit with charts and data, and not getting very far, which was frustrating. So at Christmas 1968, my mother wrapped up a special gift for my father - - a big packet of graph paper, and a promise to help him do the work to get the calculations and charts going so that they could understand better what they were looking at. My father is a brilliant man, but on his own he would not have been able to churn through all of the calculations needed, especially while working his normal job as general manager of a small manufacturing business. So it took the work of my mother, collecting and curating all the data, and performing calculations on it, so that then the two of them together could plot it and make sense of it.
What grew out of that was the indicator that my father went on to share on TV on Gene Morgan’s show in 1969. That led to their 1970 book, Patterns For Profit, which introduced the McClellan Oscillator to the world. That book also introduced the Summation Index, which is an indicator that changes each day by the value of the Oscillator, a mathematical principle my mother drew from her experience with calculus and finding the slope of the curve. We still offer copies of Patterns For Profit as an ebook, at https://www.mcoscillator.com/books_video/.
The point of sharing all of this with you is so that we can all appreciate how far we have come, and how good we have it now, being able to pull up a chart of almost anything on our electronic computer screens. It was not always that way, and part of the progress we enjoy now stemmed from the hard work done by people charting prices and indicators the original way, with a sharp pencil and graph paper.
As a final epilogue of this story, I want to share one more thing. My mother was a serious mathematician, a loving wife and parent, a PTA volunteer, a math tutor, a girl scout troop leader and later a council board member, a daughter who cared for her parents in their final years, and a volunteer in her church. She was the treasurer of Admiral Plastics Corporation, an injection molding company which my parents bought and grew, making plastic components for early computers, including for the first 8” and 5-1/4” floppy disk drive units. She was an early adopter of recycling before it was cool. She was a nature lover who planned countless camping trips that our family took together.
She also had a fun sense of humor at times. Taped to the cover of the folder with all of these old charts and ledgers was this cartoon from the Doonesbury comic strip:
Tom McClellan
Editor, The McClellan Market Report
Oct 05, 2017
Another Narrow Range for McClellan Oscillator |
Oct 16, 2015
McClellan Oscillator Interpretation |
Jun 18, 2010
All Time Record Low McClellan Oscillator |