All Time Record Low McClellan Oscillator

Free Chart In Focus email
Delivered to you every week
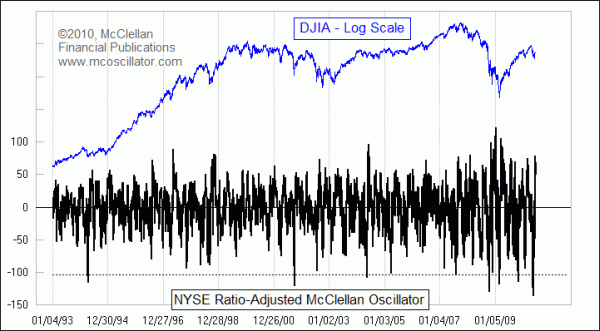
On May 20, 2010, we saw a new record all-time low reading for the NYSE's McClellan A-D Oscillator. The scary market conditions following the May 6-7 "Flash Crash" led to repeated down days for the stock market with extremely negative daily breadth numbers. The McClellan Oscillator measures the acceleration that is taking place in those breadth numbers, so to go from the gentle upsloping market we had in April to the ugliness of May was a big downward acceleration.
I normally hate to show a chart as busy as the one this week, but there is an important purpose to be served by cramming this much data into one chart. This is the Ratio-Adjusted McClellan Oscillator (RAMO), which is almost identical to our classic version shown on our Data Page, except that we adjust the daily A-D numbers to factor out the changes in the number of listed issues. The math involved in this process is explained at a page in our Learning Center.
When looking at a long-term view of the Oscillator, it is better to use the RAMO because of the changing number of issues over time. For periods of a couple years or less, the standard McClellan Oscillator is fine, and one can mentally adjust for the fact that the amplitudes may change.
When I say that May 20th saw an all-time record negative reading, I am referring to the raw (classic) version. The Ratio-Adjusted McClellan Oscillator merely made a multi-decade low. It's reading on May 20th was -136.2. For comparison, the RAMO reached -141.0 on October 19, 1987. The all-time record low RAMO reading was -176.2, back on October 10, 1932.
Now that we have dealt with a little bit of math and history, it is time to address the philosophy, i.e. what does it mean? That is the question that makes it necessary to show such a long-term chart. You can see that there are only a handful of instances when the RAMO has gone below -100 in the last 2 decades. Drawing inferences from small samples of episodes can lead to risky conclusions, but we have A-D data going back to 1926 so there are more than a few of these episodes in that larger history.
What we can say is that the meaning of an extreme low reading like this differs based on the context in which it happens. If an extreme negative reading occurs during a protracted downtrend, like what we saw in 2008, it may mark an oversold extreme but it does not usually mark the end of the downtrend. But when a reading like the recent one comes during a correction within an otherwise healthy uptrend, it marks a terminal point for that correction.
A good example was the dip in April 1994, seen at the left end of the chart. The DJIA had made what was then a new all-time high on January 31, 1994, and then by April 4, 1994, the McClellan Oscillator had dropped to an extremely low level. It was an extremely focused selling event, helped by a Fed rate hike, and a sharp reversal from the gentle uptrend. But it got over and done at the moment when the Oscillator made its extreme low. But being done going down did not mean that the market was ready to start upward right away, and it does not have that meaning now either.
Interestingly, 1994 was the second year of President Clinton's first term, and the second year is usually when bear markets arrive. We are now in a second year, and seeing a focused selling event in the spring time. It will not be too much of a surprise if the market takes until after the mid-term elections in November to start higher, which is what happened back in 1994.
Tom McClellan
Editor, The McClellan Market Report
Nov 20, 2009
NDX A-D Oscillator |
Mar 05, 2010
NYSE’s New Highs Confirm Uptrend |
May 07, 2010
What It Takes To Get The Oscillator To Zero |
May 07, 2010 What It Takes To Get The Oscillator To Zero |
Jul 16, 2010 Start Point for Summation Index Does Not Matter |