Civilian Employment Level
Free Chart In Focus email
Delivered to you every week
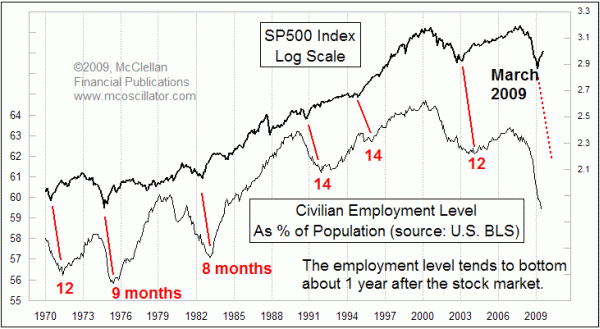
A lot of people are getting excited about the possibility that "the recession is over" or "we're turning the corner". Those sentiments are being fueled by the monthly Employment Situation Report for July that was issued by the Department of Labor on August 7. It showed a slowing rate of losses for total non-farm payrolls.
This week's chart shows that such optimism about an end to the recession is a bit premature. The July employment numbers were measured just four months after the big bottom for the stock market in March 2009. Usually, it takes about a year before the echo of a stock market bottom shows up in the employment level. Since 1970, that lag time has varied from 8 to 14 months.
For July to be "the bottom" of the decline in total payrolls, the employment numbers would have to do a really neat trick to have such a shortened lag time. A better bet would be for a bottom in the total civilian employment level around March 2010, plus or minus 2 months.
Tom McClellan
Editor, The McClellan Market Report