Confidence, and What Comes With It

Free Chart In Focus email
Delivered to you every week
There is a strong positive feedback mechanism involving consumer sentiment and the economy. As conditions get better, people get more confident, which causes them to spend more, so companies hire more, which makes people more confident….
That all works until it doesn’t, and then the positive feedback goes the other way, making people get less confident as they see the economy slowing, making them spend less money, which causes layoffs, which makes people less confident….
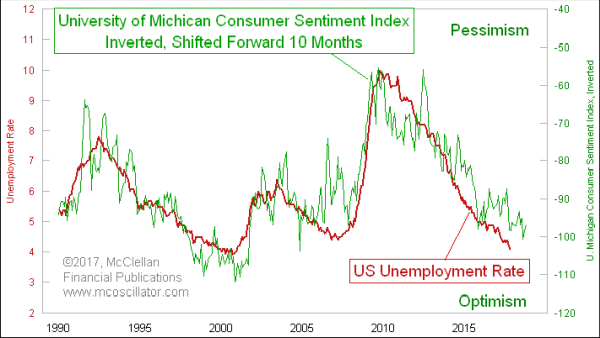
The University of Michigan’ Survey of Consumers Index of Consumer Sentiment hit 100.7 in October 2017, its highest reading since January 2004. It has backed off just a little bit since that October reading, but is still at a very high level, showing that consumers are feeling pretty confident.
This week’s chart shows the relationship of that University of Michigan number and the U-3 unemployment rate. There is an interesting lag in the unemployment numbers, and that is highlighted with the 10-month time offset employed in the chart above. I want to emphasize that the consumer sentiment data plot is inverted in that chart, so that we can better see the correlation to unemployment.
The falling unemployment rate has just been following the improvement in the University of Michigan consumer sentiment data. And because there is a 10-month lag, we can expect to see continued low numbers for the unemployment rate for the next 10 months or so. At the point when we see consumer sentiment start to deteriorate, then we can look ahead to when that change starts to show up in the economic numbers.
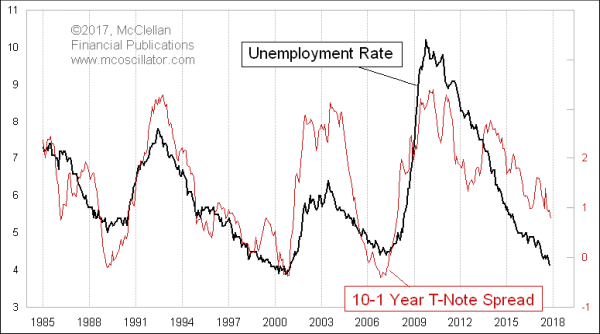
Low and falling unemployment rates have another interesting correlation, as seen in the next chart.

Many analysts are worried about the yield curve, and already proclaimed that it is about to invert and we are going to have a recession, and the Fed is clueless, and we’re all going to die, I tell you!!!! Actually, it still has a bit of distance yet to go before it actually inverts, and recession typically starts months after the inversion actually happens. So there is still some time.
And remember that the University of Michigan sentiment data give us a 10-month leading indication, and they are not showing anything troubling yet. That could change, but for now it is a good message that things are not really about to drive off a cliff.
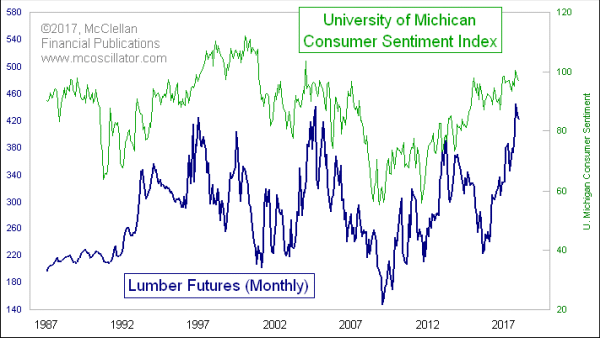
So what is it that can tell us about where the consumer sentiment data are heading? I have an interesting answer, in the final chart:

It turns out that consumer sentiment is well correlated with the movements of lumber futures prices. This one at least makes some sense, as lumber demand varies with demand for new housing. And there is no greater expression of an individual consumer’s confidence about the future of the economy than his purchase of a new home. That greater housing demand drives up prices, and produces what you see here.
Lumber futures prices recently jumped to an all-time price high, fueled in part by the hurricane cleanup efforts in Texas and Florida. The hurricane damage did not create that trend, but it may have pushed it a little farther than it otherwise would have gone. So far, lumber has not retreated much, and neither has consumer sentiment. We should see both of those give up and head downward before we start to see changes in the unemployment rate.
Tom McClellan
Editor, The McClellan Market Report
Mar 31, 2017
Lumber and Eurodollars: A Curious Intermarket Relationship |
Nov 12, 2010
The Secret Driver of Unemployment |
Sep 25, 2009
What Good Is The Yield Curve? |