Copper Inventories Rising

Free Chart In Focus email
Delivered to you every week
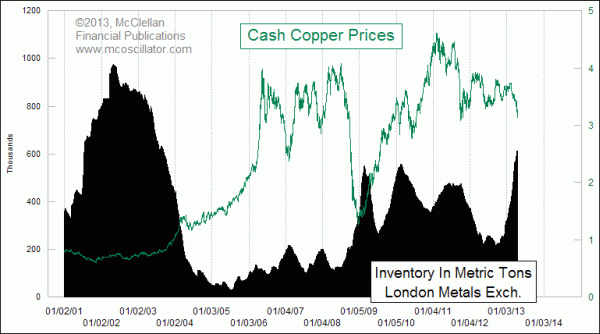
Since bottoming in October 2012, inventory levels of copper have risen 190% in warehouses operated by the London Metals Exchange. That's a huge and rapid increase, and it conveys a powerful message about the future for copper prices.
Back in September 2012, spot copper prices topped out at $3.81/pound, and they have now fallen 18%. In terms of big drops in copper prices, this one does not rank very high among the big drops in copper prices over the past few years. But it is producing a huge and rapid rise in copper inventories.
It is normal for prices and inventory levels to generally move in opposite directions. When copper producers don't like the market price and think that they can get a better one by waiting, they put their production into warehouse storage and wait for better times. When prices rise up to or above a price level that the producers like, copper starts coming back out of inventory and onto the market. So watching copper inventory levels can give us insights about where the producers think a fair price is.
It was understandable that copper inventories would rise back in 2008, when the economy was grinding to a halt, and when copper prices plummetted from above $4/pound in July 2008 to $1.25/pound in December 2008. And shortly after copper bottomed at the end of December 2008, copper inventory levels started coming back down again.
Now we are seeing an even more rapid rise in inventory levels, and it comes on just a small amount of drop in copper prices. The first message to take from this is that copper producers don't think that $3.60 is a fair price.
That's where copper was hovering just as the big run up started in inventory levels. The inventory rise makes a pretty emphatic statement that the producers think they can get a better price by waiting.
This does not mean that they have to be right. But producers spend their time dealing with copper prices, figuring out how much to produce and when to sell. So they are in perhaps a better position than some others are to know what a fair price is, and so the opinion that they are conveying with their inventory behavior is at least worth listening to.
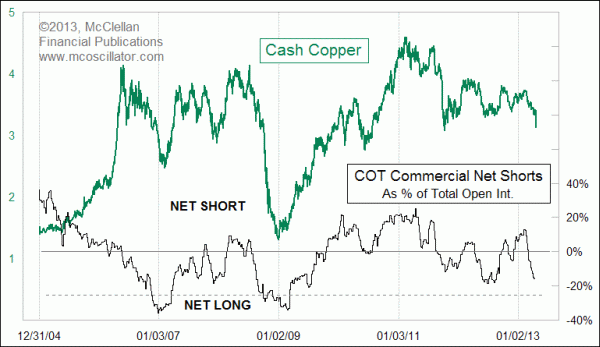
One other "smart money" group is the commercial copper futures traders, as tracked in the weekly Commitment of Traders (COT) Report published every Friday by the CFTC.

As copper prices have been falling during 2013, the big money commercial traders have been trading the net short position that they held as a group back in January, and now they are at a decent sized net long position. It is not yet as extreme of a big net long position as we saw at the major price lows back in January 2007 and December 2008, but they are getting there.
The upshot from both of these charts is that as copper prices fall, the seeds of an eventual bottom and big price rebound are being sown. Neither chart is at a point where we could say that a price bottom is imminent. But the rapid nature of the rise in inventories says it should be sometime this year rather than next year.
Tom McClellan
Editor, The McClellan Market Report
Mar 15, 2013
Canada, Mexico, and Oil Prices |
Aug 17, 2012
Taking a Look at COT Data For The Euro |
Jan 07, 2011
The Changing Relationship Between Copper and the Stock Market |