Crude Oil’s Drop Was Foretold by Gold

Free Chart In Focus email
Delivered to you every week
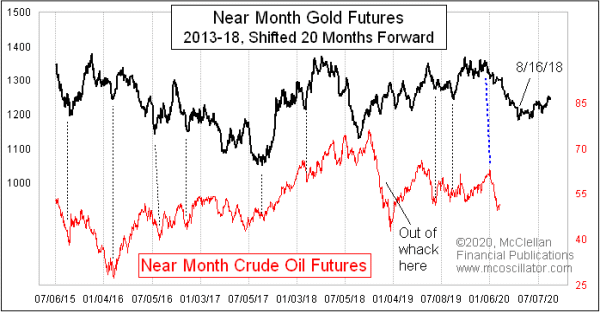
The movements of gold prices tend to show up again about 20 months later in the movements of oil prices. Crude oil futures have seen a big drop during 2020, exacerbated by falling demand from China because of the coronavirus outbreak there. That has arguably made the magnitude of oil’s price drop bigger than it would have been, but the timing of the price drop in oil still matches gold’s message.
Gold’s leading indication does not always work perfectly. The crude oil market got a little bit screwy in Q4 of 2018, and it dragged down the stock market in sympathy. But after that exceptional period, oil prices got back on track and started echoing gold’s price movements once again in early 2019 and since then.
Gold prices bottomed in August 2018, so counting forward 20 months projects a bottom for crude oil prices due in April 2020. The amplification of the decline due to the coronavirus worries means that the price damage associated with that upcoming bottom may all have been done already. But the past behavior of this relationship says that any upturn for oil prices will have to wait until that April bottom arrives.
Tom McClellan
Editor, The McClellan Market Report
Dec 24, 2014
Oil Follows Gold’s Crash Pattern |
Mar 22, 2018
Crude Oil Swooping Up On Schedule |
Feb 23, 2017
Crude Oil Foretold the Trump Rally 10 Years Ago |