Disagreement Between A-D and Volume Lines

Free Chart In Focus email
Delivered to you every week
We do a lot of work with Advance-Decline (A-D) statistics, and some people may not be aware that the same sort of analysis can be done on Up Volume and Down Volume (UV-DV) data. In the same way that we add up all of the past values of advances and declines to construct a cumulative A-D Line, we can also construct a cumulative UV-DV Line, also called a Daily Volume Line.
One big difference between the two is that every listed issue gets exactly one vote per day in the A-D statistics. But the voting is unlimited when looking at the volume statistics, so heavier volume days can move the Daily Volume Line more. Stocks that trade more shares also get to vote more, which may or may not be problematic.
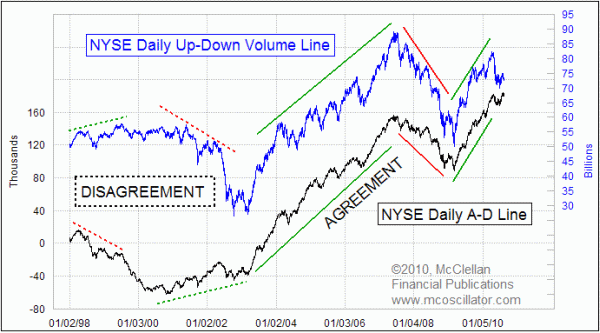
When comparing the A-D Line and the Volume Line for the NYSE data, we find that the market is most capable of making powerful trending moves upward or downward when the two are working in agreement with each other. Back in 1999, it was a problem to see the major averages still powering higher along with the Volume Line, while the A-D Line was heading south. The message then was that the big cap stocks were still doing well, hogging all of the available liquidity, while the more numerous small cap issues were pulling down the A-D Line as a symptom of poor overall liquidity.
That illiquidity problem finally resolved itself in 2003, when the Fed had restored a healthier money supply, and investors were again willing to put that money to work pushing stock prices higher. The result was a powerful uptrend for the stock market from 2003 to 2007.
Following their nearly simultaneous tops in 2007, both the A-D Line and UV-DV Line moved downward together during 2008. There was no mixed message then; it was a confirmed ugly time for the stock market.
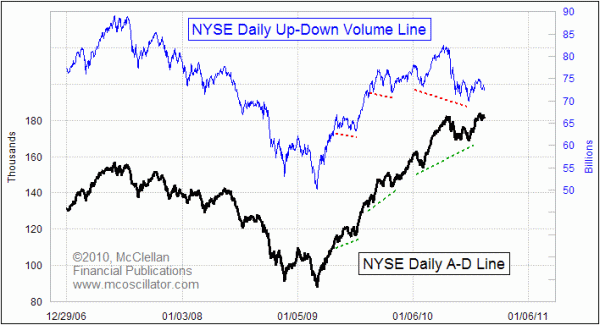
The two moved upward together in 2009, both confirming the strength of the new uptrend for stock prices. But just recently there has arisen a big disagreement between the two.

The A-D Line made a new all-time high most recently on August 9, 2010. But the Volume Line still has not made it back to the level of its April 23, 2010 high. The message of plentiful liquidity that comes from the A-D Line is not being repeated by the Volume Line, as if there is plenty of power available to push stock prices higher but not enough traction.
Disagreements like this are a sign of a disorganized market. We have seen other disagreements between the A-D and Volume Lines since the 2009 bottom, but they have been short-lived and have resolved in favor of the A-D Line's message. It is not too surprising to see a somewhat disorganized stock market during the summer of the second year of a presidential term, especially as we head into a contentious mid-term election. Investors are fearful of the unknown, and the meaning of the outcomes of those elections is a big unknown. We look for the market to get much more organized once the autumn elections are behind us.
Tom McClellan
Editor, The McClellan Market Report
Jul 02, 2010
Liquidity Is Not The Problem |
Mar 19, 2010
10 to 1 Up Volume Shows Initiation |
Mar 05, 2010
NYSE’s New Highs Confirm Uptrend |