GLD Assets Show Resurgent Interest in Gold

Free Chart In Focus email
Delivered to you every week
In spite of dollar strength, gold prices have rallied up from the low we saw back in mid-December. It took a while, but this rally has finally started to bring more interest from retail gold investors.
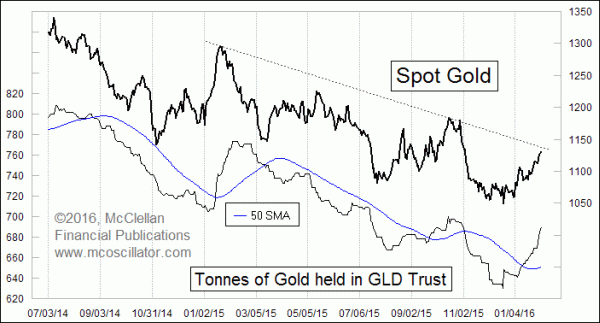
The SPDR Gold Trust, symbol GLD, reports total assets held in the ETF every day. Asset levels vary along with investor interest. If more investors want to own GLD, then the price goes up above the net asset value (NAV), and so the sponsoring firm issues more shares to restore the proper balance between share price and NAV. The money taken in from those additional share sales gets used to buy up more gold to be held by the trust. Similarly, when everyone wants to get out of GLD, the sponsoring firm sells the gold bullion, getting cash to redeems those shares, and thus keeps the NAV and share price close together.
Generally speaking, GLD assets rise and fall in sympathy with gold prices. Rising gold prices get people more excited about owning gold, and falling prices have the opposite effect.
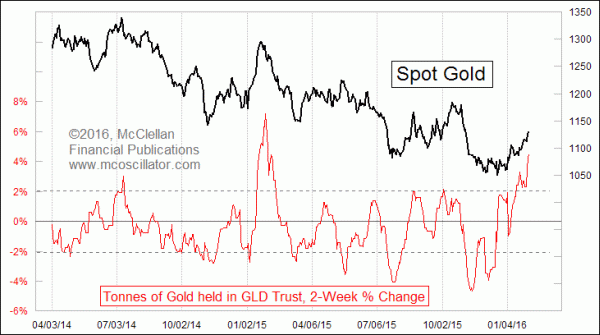
Paying attention to these changes in asset levels can be really useful as a sentiment indication. When investors are fleeing rapidly, that can be a sign of a sentiment washout suitable for a price bottom. And when there is a big surge into GLD, as we have been seeing over the past 2 weeks, it is a sign that there is huge bullish interest, a phenomenon which typically happens as gold prices are topping.
Back in December, I wrote about the sentiment washout evident in GLD, which I argued was marking a bottom then for gold prices. The total assets held by the GLD Trust had deviated far below the 50-day moving average, a condition suitable for a price bottom in gold. Now we are seeing the opposite condition; investors are surging back into GLD, and driving up the level of total assets held by the GLD Trust.
The recent surge is shown in the 2-week rate of change (ROC) of assets in GLD:

The current reading for this rate of change indicator is not the highest ever, but it is higher than all of the other recent readings except for the big blowoff in late January 2015. So we are seeing now a sentiment condition consistent with important tops in gold prices.
Tom McClellan
Editor, The McClellan Market Report
Dec 03, 2015
Gold Sentiment Washout |
Oct 30, 2015
COT Data For Gold At Topworthy Level |
Sep 11, 2014
Gold - Watch the €1000 Level |