Gold Now Bound to the Yuan
Free Chart In Focus email
Delivered to you every week
Old-school monetarists have longed for a return to having gold as the real reserve currency. So here is a fun quandary: suppose you’re a hard-core auriphile, longing for a return to gold being the world’s reserve currency. Suppose you could get what you have longed for, but with a price: China gets to call the shots. Do you accept the deal?
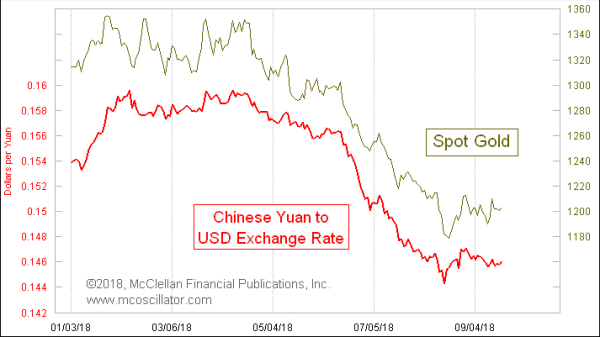
This week’s chart shows that the movements of gold prices are pretty tightly tied to the movements of the Chinese yuan. So if gold prices are ever going to start trending higher again, then the yuan is going to have to go along for the ride, or perhaps even lead the way. That’s assuming that the correlation continues to hold up as it has been doing since around August 2016.
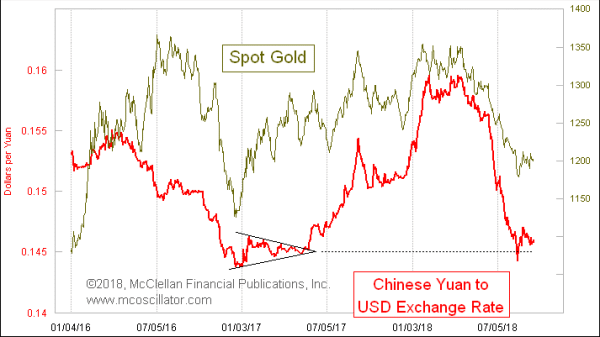
Before then, the pattern correlation was a bit more random. What the event was that caused these two to fall into a strongly positive correlation is a topic up for contemplation. I don’t have the explanation; I just see that it is so.
It is further interesting that the rapid drop in the yuan during 2018 appears to have halted itself at the level equating to the apex of a symmetrical triangle which formed in early 2017. Apices have a proven talent for showing future importance. Sometimes that takes the form of marking the moment of a turning point, and at other times the apex marks a new support or resistance level which did not exist before. The latter case seems to be working for the yuan, after a year’s delay.
The yuan seemed to be in a big hurry to drop back to that level, and it took gold lower in sympathy. Bloomberg (and others) reported on September 19 that Chinese Premier Li Keqiang has said that his nation would not devalue its currency in order to make its exports more competitive. But not mentioned in that story is the point that the yuan has already been devalued, and at a rapid rate.
Scaling back to an even longer time frame, we can see that the level where the yuan’s drop ended is even more interesting:
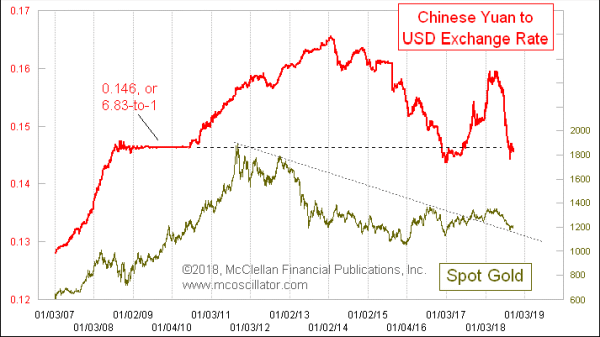
From 2008 to 2010, the People’s Bank of China held the exchange rate fixed at 6.83 yuan per dollar. Somebody evidently really liked that exchange rate, because that’s about where it is again now in 2018. And we see the yuan arriving back there just as gold prices are testing the top side of the long downtrend line, which it broke out above back in mid-2017.
It used to be that the price of gold tracked strongly with the Japanese yen, and that relationship was interesting for the additional answers it could give us. Occasionally the price patterns would disagree, and when they did it was usually (but not always) the yen which ended up being right about where the two were headed.
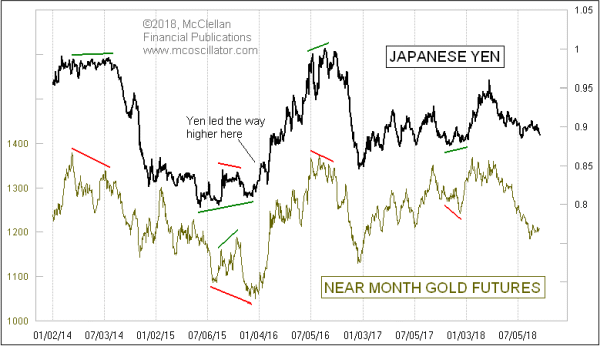
That correlation appears to be breaking down now, as the yuan has become much more dominant in terms of explaining gold’s price movements.
The key takeaway point from all of this is that if you are bullish or bearish on gold prices, then whether or not you know it you should be holding the same view for the value of the yuan. And if gold prices are ever going to go higher again, as the COT Report data are strongly saying that they should, then the yuan is going to have to give its permission for that move to take place.
Tom McClellan
Editor, The McClellan Market Report
Sep 06, 2018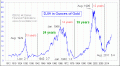
DJIA/Gold Ratio |
Jun 29, 2018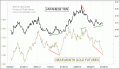
Japanese Yen Disagrees With Gold |
May 03, 2018
Gold/Silver Ratio |