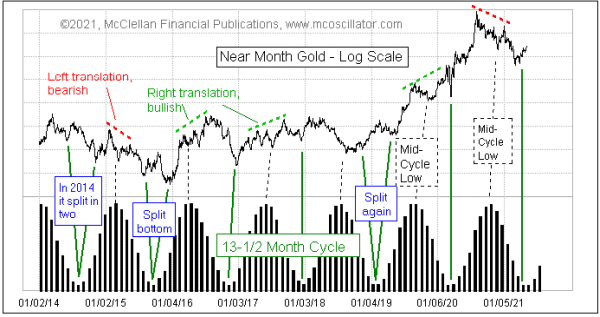
Gold’s 13-1/2 Month Cycle In Up Phase

Free Chart In Focus email
Delivered to you every week
There is a dominant cycle in gold prices with a period of 13-1/2 months. But its behavior is more complicated than just saying that gold makes a bottom every 13-1/2 months.
The first interesting aspect of this cycle is that around the time of the cycle’s peak, gold usually makes a mid-cycle low, like a camel with 2 humps. Even more interesting is the point that the arrangement of the tops on either side of that mid-cycle low gives us information about what lies ahead.
In a case of “right translation”, the peak after the mid-cycle low is higher than the peak before it. That is a bullish configuration, and it says that the major cycle low might arrive at a higher level than the mid-cycle low. It also promises good things once the next cycle’s new upward phase starts.
In “left translation”, the left peak is higher, and what usually follows is that the major cycle low is at a lower price than the mid-cycle low.
One new development which has occurred several times in the past decade is that the major cycle low can split itself into two separate bottoms, on either side of the ideal due date. That can be really frustrating to interpret if it is happening in real time.
The past two major cycle lows in gold prices have seen the price bottoms arrive pretty much on time, including the one that got magnified by the Covid Crash in the financial markets. The last cycle saw left translation, and sure enough this latest major cycle low was lower than the mid-cycle low.
Now gold is in the ascending phase of the new cycle, which is when the best gains for gold prices are usually seen. Sometime this autumn, we will need to start worrying about the next mid-cycle low appearing, and thus to get a left-hand top before that mid-cycle low. And much later on, we will get to make a determination about whether this new cycle will see right or left translation. For now, the mission is to ride the new uptrend.
Tom McClellan
Editor, The McClellan Market Report
Sep 07, 2017
Gold’s 13-1/2 Month Cycle: Right Translation |
Sep 24, 2020
Gold and Small Caps, A Broken Relationship |
Jan 14, 2021
Gold Leads Interest Rates |