Household Debt Shrinking

Free Chart In Focus email
Delivered to you every week
Debt is bad, at least for you and me. But debt held by others can be a wonderful thing, as long as it is increasing. Debt is only a problem at the point somebody decides to do something about it.
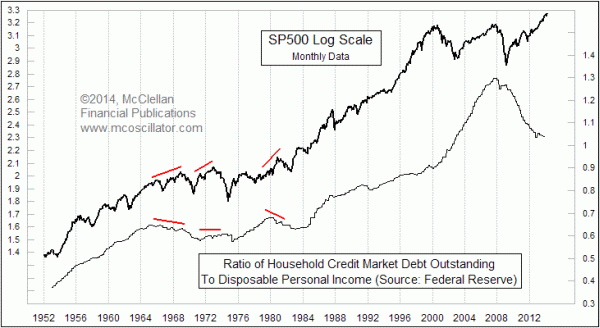
The unfortunate fact for stock market investors is that household credit market debt as a percentage of disposable personal income has been shrinking ever since the peak back in 2007. Normally it is bullish for stock prices to see household debt increasing, and bearish to have household debt decreasing. But occasionally the two can go in opposing directions, which is the condition we see right now.
Historically when such a divergence has happened, the stock market eventually realized that it had wandered off track, and it worked extra hard to get back with the program. But here we are, almost 7 years into a decline in household debt versus income, and thus far the stock market shows no sign of recognizing its off-track condition. It is a bigger and longer divergence that we are accustomed to seeing in past episodes, such as those labeled in the chart. The most likely explanation is that the Fed is helping to push up asset prices, in hopes that such action will eventually help push down unemployment rates and other indications of economic malady, and that this action by the Fed is continuing the divergent condition much longer than normal.
The Fed's data on household credit market debt only extend back 62 years, which is just barely one interest rate cycle period, but is still a pretty long period of time. And in that time, there has never been an instance of stock prices moving up while the debt to income ratio moved down that did not resolve itself by having stock prices moved hard downward to get back on track. I do not see it as good news that the stock market is now going for its longest divergence ever in this regard. I instead see that as a sign of trouble that will eventually have to be paid back double once the reckoning commences.
It is understandable at this moment in history that we are seeing debt decrease, or perhaps I should specify PRIVATE debt. U.S. government debt, on the other hand, has doubled in the past 8 years. Through either willful action or neglect, Congress has been taking up the slack in the debt market. But while Congress is still on a spending spree with other people's money, Baby Boomers are facing retirement from an ever closer vantage point, and realizing that piling up 2nd and 3rd mortgages on McMansions is not a great way to prepare for the day when the paychecks stop coming. So they are doing the wholly rational action any reasonable person would do, increasing their savings and reducing their debt.
The big problem, though, is that there are a whole lot of us Boomers trying at the same time to reduce our debt and get ready for retirement. The "echo boomers" and millenials are not feeling any compulsion to take up the slack. They would rather live in Mom & Dad's basement than take out their own mortgage to relieve the Boomers of those McMansions, which leaves the housing market moribund, the banking system seeking yield wherever it can find it, and the Fed trying to fill the void with free money. So far that has not reached a trigger point that would cause the stock market and the banking system to reverse course, but I have to figure that such a reckoning day is coming. It always has before, eventually. And if the crude oil leading indication is right, it could take until 2018 before that reckoning point will appear and start to matter.
Ironically, if Congress ever decides to mend its ways and step back from the ever-increasing debt levels, then history shows that the stock market could be in for real trouble. As long as we are spending somebody else's money for whatever we want, the party goes on. The only time that the problem manifests itself is when somebody tries to do something to solve the problem.
Tom McClellan
Editor, The McClellan Market Report
Nov 27, 2009
Why You Should Fear A Balanced Budget |
Jul 13, 2012
Stock Market Says We Can’t Solve Budget Problems With Taxes Alone |
Nov 21, 2013
Perhaps The Only Chart That Matters (For Now) |
Jan 04, 2013
Employment Levels Stubbornly Unresponsive |