In Order To Tame Inflation, Just Tame Uncle Sam

Free Chart In Focus email
Delivered to you every week
I love playing with correlations, and finding seemingly unrelated sets of data that seem to behave the same way. I am always mindful of the admonition that "correlation does not mean causation", in part because so many people like to remind me of this anytime I mention correlations. But correlation of two data sets does hint at a common thread.
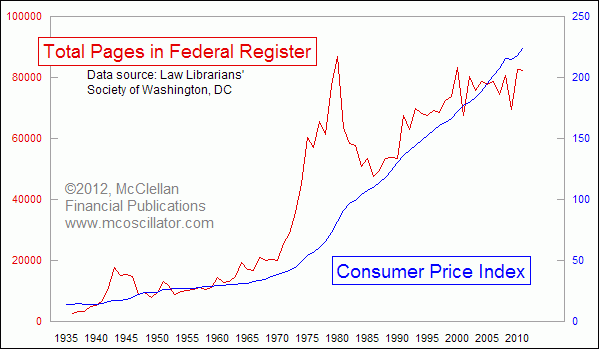
In 1993, when I was just starting out, I heard Jim Bianco of Arbor Research give a presentation at a Market Technicians' Association conference. One of the fun charts that he shared was this week's comparison between the number of pages in the Federal Register and consumer price inflation.
The Federal Register "is the official daily publication for rules, proposed rules, and notices of Federal agencies and organizations, as well as executive orders and other presidential documents." So the size of the Federal Register is a decent gauge of just how busy the US federal government has been. It is published by the Office of the Federal Register, and distributed by the Government Printing Office. The latest edition, if you got it in paper form, weighs over 340 pounds (154 kilograms).
This week's chart compares the number of pages of the Federal Register to the raw Consumer Price Index for All Urban Consumers (CPI-U). The 12-month change of this CPI measure is the most often cited inflation rate, although Ben Bernanke lately has expressed a preference for using the GDP deflator, perhaps because it is lower.
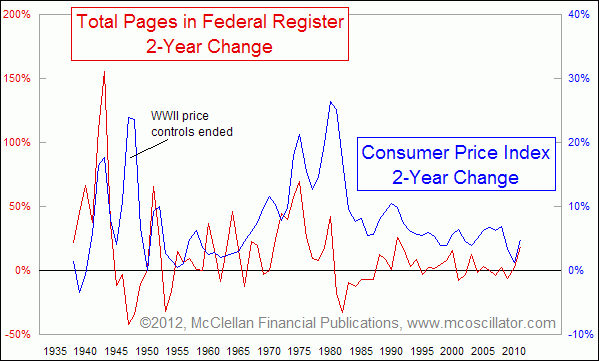
If we were to look at rates of change for the Federal Register pages and CPI, it would look like this next chart, which uses a 2-year rate of change to smooth out the data more:

Generally speaking, inflationary periods for consumer prices seem to coincide with expansionary periods for government activity, as modeled by the size of the Federal Register. Whether one is a response to the other is a much harder point to prove, but it is easy enough to see that there is a relationship there. Wars also bring more activity in the Federal Register, as well as inflation, although if the government imposes price controls as it did in WWII and the Vietnam War, then the effect of that inflation on consumer prices can be delayed.
Can we say for sure that shrinking the size and scope of the federal government's activities would necessarily bring about low inflation? Probably not. But it would be an experiment worth trying, so that we can see what happens to the data, and for other reasons as well.
And as for why keeping inflation down is important, please see this 2009 article about the relationship between the inflation rate and the crime rate.
Tom McClellan
Editor, The McClellan Market Report
Nov 18, 2011
One to Three Years Left For Gold’s Run |
Sep 02, 2011
Weak Housing Data Conceals Real Inflation |
Jun 10, 2011
Architecture Billings Index Forecasts The Economy |
Aug 06, 2010
Correlations May Not Be What They Seem |