Oil Prices Look Different in Euros

Free Chart In Focus email
Delivered to you every week
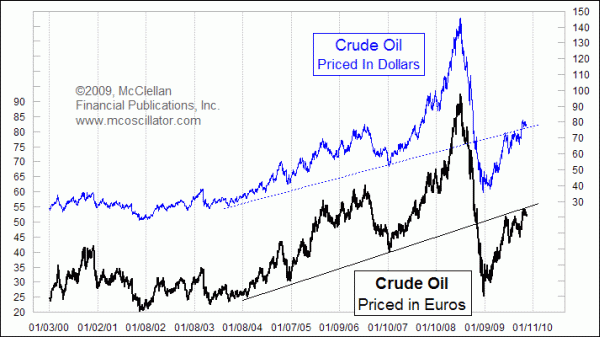
Crude oil prices have more than doubled since hitting a low of $35/barrel last December. When looking at a chart of crude oil as priced in dollars, the price has climbed back up on top of the rising bottoms line that was broken on the way down from the bubble top. Climbing back on top of a broken uptrend line is a bullish act, because often a broken support agent can turn into a resistance barrier. Climbing through it says the resistance is not that great.
But when we look at the price of oil measured in euros, it is a different story. The chart pattern of each looks almost identical to the other, since the inherent volatility in oil prices far outweighs the magnitude of the dollar's movements versus the euro. But the euro price for oil is acting differently when it comes to its equivalent uptrend line. Rather than climbing up on top like the dollar price of oil has done, the euro price has experienced that broken uptrend line as a genuine resistance agent.
So which one is correct?
This is a classic quandary facing technical analysts in the modern age. Back when Edwards and Magee were writing about stock price chart patterns, the vast majority of people trading those stocks were Americans who were all dollar based. There was no conflict over currency translations for stock prices.
Now we live in a world where nearly everything can be traded around the world, any time. Each trader has a different currency in which he thinks, and upon which he bases his trading decisions. So what might seem like an overbought condition for prices of something in one currency could be just an ordinary condition for the price of the same article portrayed in a different one. When it comes to oil and the euro, there have been a lot of rumblings among countries about changing the basis for pricing oil trading from dollars to euros. In reality, the currency in which prices are quoted makes no real difference. A big oil company which operates in euros can easily convert its currency to dollars if it needs to pay dollars for oil. The same is true if it were the other way around. So we should not make inferences yet about the euro price chart being "right" and the dollar chart wrong just because of the shifting tides in the world oil markets.
Still, when comparing these two charts, in one case we see the dollar price piercing a resistance level, while in another case we see the euro price halting there. Both cannot be correct. Either oil is going to continue upward or it is not.
In my view, the most likely outcome is that the dollar price's upward penetration will turn out to be a "false breakout", and the resistance that the euro price is experiencing will control the situation. Oil prices should back off a bit, especially if the dollar itself starts to rebound. It is unlikely we'll see $145 oil again any time soon, just as it took two decades for stock prices to get back to the bubble top seen in 1929.
Tom McClellan
Editor, The McClellan Market Report