Panics We Have Seen Before
Free Chart In Focus email
Delivered to you every week
The financial media like to say that except for the Great Depression, we have never seen a market decline like the one which unfolded in 2008. This says more about the myopia of the media than it says about the current market. Decades ago, panics in the financial markets were regular occurrences, a factor which has been only slightly mitigated by the efforts of the Federal Reserve.
Back in 1903, there was a horrible banking crisis and panic on Wall Street. Depositors rushed to make redemptions, which threatened to shut down the banking system because banks could not get their hands on enough money to meet redemption requests. Big banker James Pierpont (J.P.) Morgan stepped in and served as the "lender of last resort", organizing other bankers in an effort to meet the demands of an illiquidity event. Without much federal intervention, the crisis eventually passed, and the stock market recovered.
A nearly identical panic arrived exactly 4 years later in 1907, with a similar response and outcome by the bankers at that time. It was these twin panics that helped to convince Congress in 1913 to establish the Federal Reserve, so that the federal government could have a mechanism to step in and act as the lender of last resort instead of relying on private banks to do this for themselves, or to fail for a lack of liquidity.
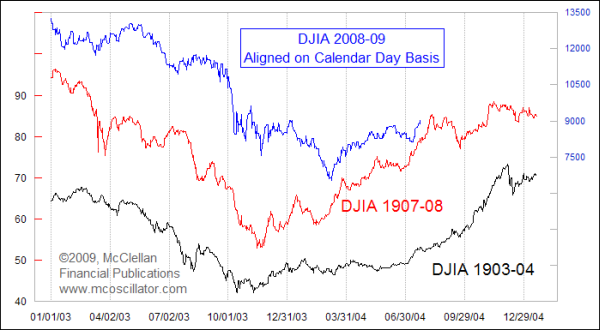
The chart above compares the 2008 market decline to the panics of 1903 and 1907. All three price plots are aligned on a calendar day basis, which reveals that annual seasonality of stock market movements also played a part in the way that the price structures formed. The dates on the X axis of the chart are from 1903-04 but you can do the mental adjustment to reflect that 1903, 1907, and 2008 all share the same dates for this comparison. The correlations of these three price patterns are not exact, but it appears clear that they are each playing their own version of the same song. This implies that the "physics rules" of how the financial market goes through a financial panic event are similar, despite separation of over 100 years and despite all of the advances we have made in our banking systems and trading vehicles.
This recent rally was just a little bit late in getting started, but is unfolding on schedule. Right now, both the 1903 and 1907 patterns say that the market should be heading higher. And both prior periods show a bottom in late September, followed by recovery. There is a difference between the two prior examples in terms of how the DJIA headed down toward that late September bottom, and thus there is room for the current market to find its own way there following a top which I am projecting for around Aug. 14, based on other predictive tools.
Tom McClellan
Editor, The McClellan Market Report
Dec 18, 2009 Drop in inflation should bring DROP in crime |
Jan 15, 2010 Stock Market Repeating the Sideways 70s |
Sep 11, 2009 Is a Higher Savings Rate a GOOD Thing? |
Feb 12, 2010 Birth Rate and the Stock Market |