Unusual Stochastic Makes Good Oscillator
Free Chart In Focus email
Delivered to you every week
Have you ever noticed that during downtrends, prices will more often tend to close near the low of the daily range? And during uptrends, the opposite seems to occur. Years ago I wondered whether I could build an indicator that would quantify such behavior. A few spreadsheet formulas later, I came up with the indicator in this week's chart.
I'll tell you how it is built, because it is pretty easy for you to replicate in almost any modern charting program, including some free web sites. More on that below. What I did was to take each day's closing price, and mathematically characterize it according to where it falls within each day's high-low range. I expressed that on a scale from 0 to 100.
The raw daily values were pretty noisy, as you might imagine. Prices can be up one day and down the next, hiding the true trend in a fuzzy jumble of up and down spikes. Some smoothing was in order to try and distill the trend information hiding in the data. I tried different periods for smoothing, and tried both simple and exponential moving averages. I settled on a 10-day simple moving average because it seemed to work the best visually for giving good overbought and oversold readings, and just as importantly for withholding bad ones.
After congratulating myself for creating a wonderfully new and innovative indicator, I realized that the mathematical formulas involved are the same as for a stochastic oscillator, which most technical analysts already use and are familiar with. Most people use a lookback period longer than 1 day, but the analysis of where a day's closing price falls within the range over a lookback period is the essence of what stochastic oscillators measure. 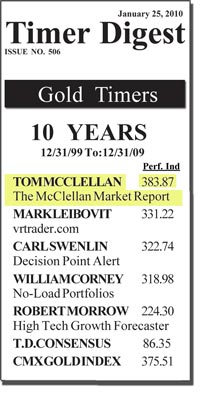
As mentioned above, you can create this indicator yourself for the XAU or any other price series. In your charting program, create a stochastic oscillator, then specify 1 day as the "length" or lookback period, and 10 days as the setting for smoothing. Here is the coding for Metastock users, courtesy of Greg Morris:
DR:=(C-LLV(L,1))/(HHV(H,1) - LLV(L,1));
Mov(DR,10,S)
For a 9-day, 14-day, or longer period stochastic, the 20 and 80 levels are usually used to mark high and low indicator extremes. Those levels do not work on this very short term version. I have found that 40 and 60 work well for that purpose.
For the latest posting, this indicator is showing a really nice oversold condition for the XAU. The decline does not absolutely have to be over just because this or any indicator is oversold, but it does suggest that a bounce is imminent for gold stocks.
Tom McClellan
Editor, The McClellan Market Report
Jan 08, 2010 The One Real Fundamental Factor Driving Gold Prices |
Nov 20, 2009 NDX A-D Oscillator |
Dec 04, 2009 How Gold Forms Tops |