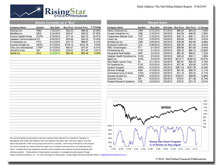
The Rising Star Stock Program is a stock entry and exit timing system. The buys and sells are generated via technical indications that are particular to each stock, and without regard to outside factors. Subscribers to our Daily Edition receive the new buys and sells generated each day, along with a running tally of the performance of the stocks bought and sold in the program. The key feature of this information is that it is not just about what stocks to buy and sell, but when.
Investors can also participate in the Rising Star Stock Program as managed accounts program run by Global Investment Solutions LLC. It is intended for clients with at least $100,000 to invest.The expectation is that the program should garner higher than market returns during uptrending periods through investment in higher beta stocks, and lower than market losses during downtrending periods by rotating out of stocks as each stock triggers a sell signal. Backtesting with actual stock market data through two complete bull/bear market cycles shows that this expectation is reasonable.
Buys and sells are made within a mostly fixed pool of stocks, chosen for being large enough in capitalization to have healthy trading liquidity, and having higher beta ratings. This means that these stocks are expected to move upward faster than the market during uptrends, but they can also move downward faster during downtrends.
The key assumption underlying this program is that the stock market in general will oscillate up and down, and that the stocks which are in the eligible pool will to a large extent follow the general market. But each stock has its own behavioral characteristics, and so following the signals of each stock independently may produce superior portfolio performance compared to making timing decisions based on the overall market.
Rising Star FAQ
Backtesting
Backtesting was done on a basket of 51 potential stock candidates. Each buy and sell signal in each of those stocks was monitored starting on Dec. 31, 2002. Over that period of time, the basket of stocks produced 1,655 closed trades. The winning ratio on these trades was 52%, which means that about half of the trades were closed at a price lower than the entry price. But the average winning trade produced a gain of +21.85% while the average losing trade produced a loss of -6.68%. The average holding period for winning trades was 47 days. The average holding period for losing trades was 16 days. These statistics are based on hypothetical trading using historical data, and do not reflect performance from actual trades.
The entire basket was also tested from 12/31/2007 to 3/31/2010. Each position was notionally bought or sold in the hypothetical portfolio based on directional signals generated from the closing price, and using the opening price on the day following the signal for system performance measurement. During the largest bear market in recent history, the SP500 had a draw down of greater than -52%, and a single day that saw the index drop -9.85%. During that period of time, the hypothetical portfolio had a maximum drawdown of -17.75%, and a worst single day of -4.53%.
Following the system development work, we monitored the portfolio during 2009 and we were satisfied with its real-time performance. It went live as a trading program for actual accounts starting Dec. 1, 2009. Depending on when an account enters the program, initial performance would differ from the ideal account performance because new positions would be entered only as new buy signals were generated on the stocks in the pool. For actual performance information, please contact Global Investment Solutions at (949) 660-7960.
Tax Efficiency
The tax efficiency of entering and exiting trades is not a consideration for this program. The expectation is that most trades would be categorized by the IRS as short term capital gains (or losses).
Type of Stock in the Pool
Stocks are chosen for inclusion in the pool based on trading liquidity and higher than average beta. The effect of these selection criteria is that stocks with higher earnings growth rates and higher than average P/E ratios were chosen. The intention is to retain a relatively fixed pool of stocks, but mergers and acquisitions may compel changes in the stocks in the pool. And periodic reviews will be conducted to ensure that stocks in the pool still retain the behavioral properties to qualify them for inclusion in the program pool.
Directional analysis
The indicators which generate "buy" and "sell" signals fall into the category of "directional analysis" indicators. The exact parameters of these indicators are proprietary, in part to prevent others from front-running the trades made in this program.
Position Size
With the current size of the pool at 51 stocks, a larger account size would achieve greater system efficiency through trading more of the stocks in the pool. As the size of a portfolio shrinks, the cost of trading commissions begins to eat into the performance when trading every stock that generates a buy signal, and so the total number of positions in an account would be reduced. Accounts would be domiciled at a discount brokerage firm, so that cost of trading commissions is minimized.
If the portfolio is less than $250,000, the number of positions would likely be capped at 20 stocks. For portfolios larger than $250,000, the target number of positions would be 35 stocks.
During periods of rising stock prices, such a portfolio would become fully invested rather quickly. As the overall market tops out and stocks generate a sell signal, the portfolio would be raising cash as holdings in the portfolio each triggered its own sell signal.
Stops
The model used in this program does not use a specific price or percentage level as a protective stop on a position. Instead, the same directional indicators which generated a buy signal will at some point also trigger a sell signal if prices move downward over time. This creates additional risk on a single stock's position of having an adverse price move shortly after entering the trade. That risk is minimized by spreading the portfolio over multiple different stocks, so only a small percentage of investable capital is concentrated into a single stock position.
While the average losing trade produced a -6.68% loss during back testing, there were many trades where the loss was greater than the average. For this reason, proper position sizing is imperative. Risk to the portfolio from an adverse price move in a single stock would be increased as the number of positions in the portfolio is reduced. This is mitigated by the increase in cash as positions are sold. Too much concentration into a small number of positions creates greater risk, therefore the size of remaining long stock positions is not increased as other stock positions are sold.