Can the McClellan Oscillator be used for day trading?
Can the oscillator be used for day trading? If yes, which parameters and best time frame for the best results?
Thanks for writing. The short answer is “no”, but that is not the final answer.
The McClellan Oscillator is based on the daily number of advancing and declining issues on the NYSE. Other permutations are also done with Up and Down Volume, with data from other exchanges, with data on other sets of stocks, etc. We use the final closing numbers for our calculations, although we can and do look at the intraday values for the numbers of advancing and declining stocks so that we can calculate the theoretical McClellan Oscillator value if those were the final numbers for the day.
On our Data page, you can access an Excel spreadsheet that allows you to calculate the McClellan Oscillator. What you can do intraday is type in the current A-D numbers and copy a row of formulas down to see what those A-D numbers would mean for the Oscillator if they were the final numbers. The A-D numbers are constantly changing throughout the day, but you can do a “what if” analysis for any given numbers.
The data on the number of advancing and declining issues is traditionally done on a day to day basis, not intraday. In order to calculate the number of advancing and declining issues, it takes a lot of data and a big database operation. One must know the list of stocks traded, and their closing price yesterday. Then one must know whether today’s price is above or below yesterday’s for each of those stocks, and then this must all be tabulated for the entire list to count the numbers of those stocks closing up and down.
Intraday traders are accustomed to using other tools and indicators that are taken from daily analysis and using them on and intraday chart. For a 20-bar moving average, the computer does not really care whether those bars are 1 day long or 5 minutes long. But when you want to start calculating A-D statistics for the entire exchange, then you have to know where every stock was at every time increment, and then do calculations based on that. Even with the computing power we all have today, that gets to be an onerous calculation task.
But there is one piece of data that is available on most quote systems that is pretty close to being the same thing as intraday breadth, and that is the TICK. To calculate Tick, the exchanges look at all of the stocks being traded and measure whether each is trading on an uptick or a downtick, meaning which direction was the last change in price. In this case, the “time increment” being used is not one trading day, but rather how long it has been since the last change in direction for each stock’s price. Because stocks trade with differing frequency throughout the day, that time increment will not be uniform. Still, the Tick can be a very useful indicator, especially when it shows divergences intraday relative to prices.
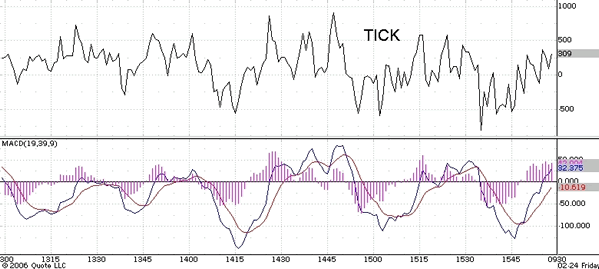
If one wanted to try to use a McClellan Oscillator calculation on Tick data, one could do it fairly easily in most charting software programs by calculating a MACD of the Tick value. Instead of the default values of 12 and 26 bars set in most programs, substitute 19 and 39 bars, and specify Exponential Moving Average rather than simple moving average. You could then have what is functionally a McClellan Oscillator of the Tick. You would want to have a very short time increment for your study, probably a 1-minute chart unless anything smaller is available. Anything longer than that would result in a sampling error, because Tick can move all over the place within a span of 5 minutes, so finding its value at the end of that 5-minute period might be a bit too arbitrary.
The two charts show an example of this. You can see that there is a nice correlation between this 19-39 oscillator of the TICK readings and the movements of the SP500.


I have not studied whether this could be incorporated into any sort of trading system. Perhaps that is something you might wish to do for yourself if you have the tools and the data available. Thanks for writing, and for the good question.