Time For A Change In How We Track Volume Data
Starting 3/08/2012 we changed how we track volume data.
It has long been a frustration of ours that there is no consistent way to look at the data for NYSE trading volume. It used to be that all trading of NYSE stocks got done on the NYSE floor. But over the years, a lot of that trading has migrated off the floor to other trading platforms, places with exotic names like BATS, EdgeX, and Arca. According to the Wall Street Journal, the largest trading platform in terms of share volume of NYSE-listed issues is the NASD Alternative Display Facility.

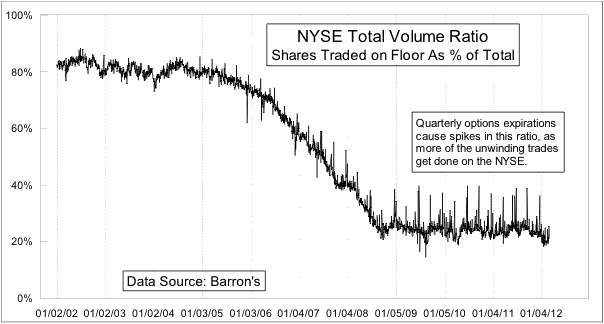
Barron's has been publishing total volume numbers for both the NYSE floor only and the composite volume going back several years. Their numbers match what is reported in the Wall Street Journal, since both publications share the same database. The top chart helps to illustrate why this issue of floor versus composite volume has become much more of an issue in recent years.
Unfortunately, for tracking Up Volume and Down Volume, WSJ/Barron's had stuck to just giving NYSE floor numbers. For years, there has not been a reliable public source for composite Up-Down Volume data. WSJ/Barron's finally got around to reporting the composite Up-Down Volume numbers a year ago, and so now we have a full year's data to look at. This is the reason why we are now making the change for the charts which appear on page 3 of every McClellan Market Report.
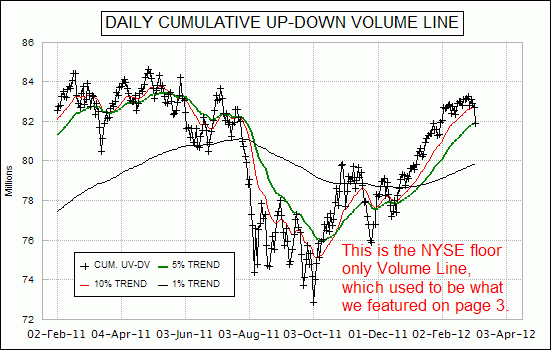
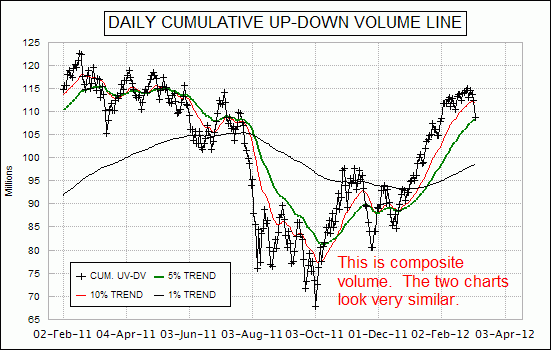
The charts below compare what the cumulative Daily Up-Down Volume Line looks like with the NYSE floor only data, which is how we have been showing it up until now, and what it looks like using the composite Up-Down Volume data. The second chart is the one that will appear from now on in our twice monthly McClellan Market Report newsletter. You can see that they really look almost identical, although the composite version seems to be a little bit better behaved.


So if they look the same, why change? The big reason is philosophical. If we are looking at volume, we should look at all the volume, and not throw out some of the data. But we did not want to make the change before there was enough data to go with, and before our readers could reasonably do the same. We have long used the WSJ/Barron's numbers as the official data because they are very good about data accuracy, and because they are publicly available to everyone. Through other means, we do have some data on composite Up and Down Volume that predates the start of that data reporting by WSJ/Barron's, but unfortunately the data which overlap do not agree exactly. In fact, all of the different original sources of such Up-Down Volume and other breadth data disagree, which is another frustration.
Part of the issue is that there is no standard definition for the “close” of trading. So each data vendor, including WSJ, picks some moment well after the closing bell to cut off the trading day and finalize the numbers. Picking a different moment will result in different numbers.
For those who want to keep score at home, we have posted an Excel file with several different sources' versions about what the data say. That file has documentation and explanatory notes regarding the sources of each part of the data. Going forward, we'll be using the WSJ/Barron's numbers for composite Up-Down Volume in all of our reporting.