A-D Line Has the Story on Corporate Profits

Free Chart In Focus email
Delivered to you every week
We spend a lot of time looking at the data for advances and declines in the stock market, especially the numbers for the NYSE. Analysts who eschew technical analysis might be surprised to find out that A-D data have something useful for them: The A-D Line tells us where corporate earnings will go.
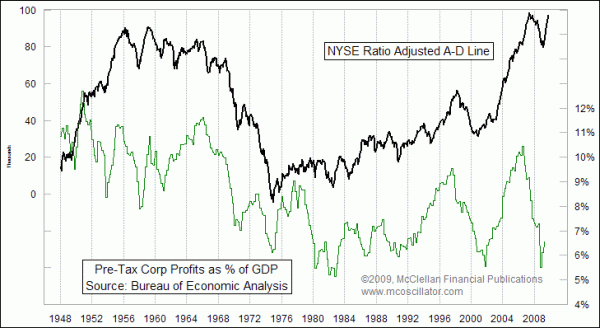
This week's chart compares the NYSE A-D Line to some data on corporate profits compiled by the Bureau of Economic Analysis. The raw corporate profits data comes out of a report called National Economic Accounts, and you can access the raw data if you like at this link BEA Profits Data. The profits line is line 17 of that table.
This corporate profits data is different from what you might see on the earnings for publicly traded companies, or for those stocks in an index like the SP500. The BEA's profits data looks at all companies, public and private. It is divided by total GDP to result in a percentage that you see portrayed in the chart.
Now that we have covered the details about the data, let's get to the good stuff. You can see in the chart that there is a really strong correlation between the A-D Line and corporate profits. When liquidity is strong enough to lift the majority of stocks, and make the A-D Line go up, that same liquidity tends to drive corporate profits higher.
This may seem like something that is so overly obvious that it does not even merit our attention, but a little bit more thought will reveal why this is important. The A-D Line tells us in real time what the condition of financial liquidity is. Earnings, on the other hand, are a lagging indicator. Earnings have to be compiled by the company bookkeepers, reported, and then aggregated for composite reporting like this. In fact the most recent data on corporate earnings that is available from the BEA is the 2nd quarter (April to June) of 2009. So this measure of corporate profits has not yet reflected the growth that we have already seen in the A-D Line. And the A-D Line is within just a few thousand net advances of making a new all-time high.
Other earnings data will be more up to date, such as the earnings for publicly traded companies, but it will still have a compiling and reporting lag built in.
Three immediate conclusions jump out:
First, any reports of a continuing low degree of profitability for American corporations should be viewed with great skepticism. The rapid rise in the A-D Line says that we should see a rapid rebound in this corporate profit data, as the 3rd and 4th quarter numbers are eventually released.
Second, if forecasters want to get a preview of what corporate profits are going to look like, the A-D Line gives us those answers.
Last, if someone decides to wait for the earnings news before deciding how the stock market ought to behave, he is going to be a step behind. Earnings don't tell us how the stock market is going to move; it is the other way around. The stock market tells us what earnings are going to do.
Tom McClellan
Editor, The McClellan Market Report
Jan 01, 2010 Nasdaq A-D Line “Divergence” |
Oct 30, 2009 A-D Line Back Near All-Time Highs |
Nov 20, 2009 NDX A-D Oscillator |