A Seasonal Quandary

Free Chart In Focus email
Delivered to you every week
When every other segment on financial TV is about the question over whether to "Sell In May And Go Away", it is natural to wonder whether the belief in seasonality has become overdone. When everyone believes in something so thoroughly, especially about the stock market, can it still remain valid?
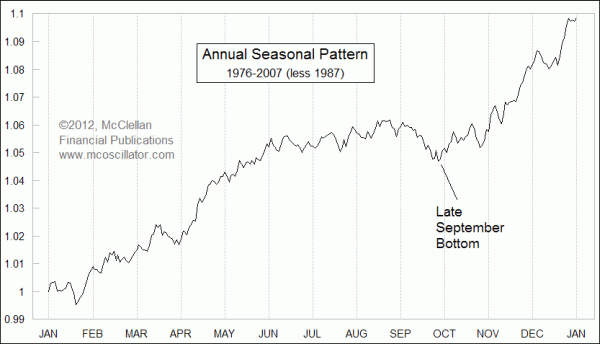
If you were to average together the market's performance in one year chunks of time, it might look something like this week's chart. It is made up by averaging together the performance of the DJIA each year from 1976-2007. I throw out 1987, just because the magnitude of the up and down moves that year tend to drown out the other voices to an extreme extent. I also prefer not to include the most recent years, when the Fed has had its foot on the neck of the financial markets. If you want to get an average picture of what "normal" looks like, don't include the abnormal and steroid-enhanced.
The first point that jumps out at you about the Seasonal Pattern is that the very old saw about "Sell In May And Go Away" is off by a month. The average seasonal pattern really tops out in June, or at least that has been the case since 1976. This may be a change from earlier years when traders vacated New York City at the earliest opportunity to head to "the shore" in May and stay away for the entire unbearable muggy summer. Now, thanks to the insights and advancements of Willis Haviland Carrier, traders can stay in New York and toil away well into June.
So the old saying about "Sell In May..." ought to get updated to "Sell In June, and, um, (something witty that rhymes with June)." It is not quite as satisfying this way, which perhaps explains why the old version persists.
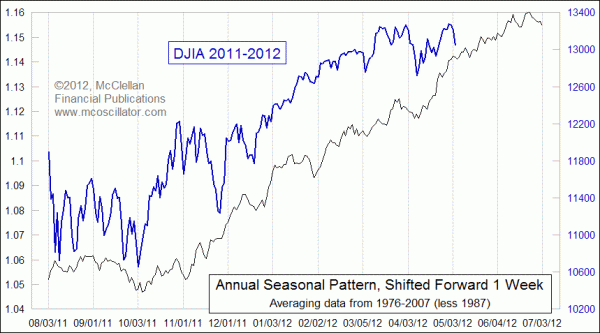
So, now we know that we should not sell in May, if we are to believe the historical pattern. But here's the problem: the current market is off schedule by a week. If we were to align the current DJIA pattern with the average seasonal pattern, it does not come out quite right. I've found that I have to offset the pattern by a week just to get the structures to line up. And once I make that adjustment, they line up quite nicely:

The implication is that the current market is running a week behind schedule. You can insert your own joke here.
The further implication is that prices should keep on trending higher through June and into July. That's if you believe the annual seasonal pattern.
The truth is more complicated, and it boils down to this: It's different in an election year.

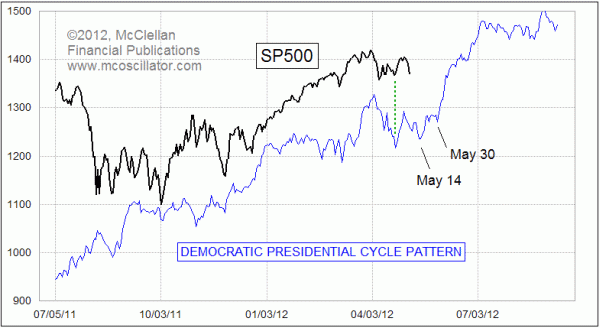
This chart of the Democratic Presidential Cycle Pattern substitutes the Seasonal Pattern's 1-year chunk of time for a 4-year chunk, averaging it together in the same way, but with a twist. In this version, I am including 4-year chunks of time only from when a Democrat has been in the White House. When viewed in this way, the whole rule about "Sell In May..." goes completely out the window. May's mission in election years seems to be to convince everyone to sell, and May seems to have recruited all of the business news reporters to tell that story on its behalf.
The real story during election years, especially when a Democrat is in the White House, is that May is a month for correcting, while June is a month for screaming higher. The timing of the turns is more important with this tool than calculating the magnitude of the move. Coming up just ahead is a bottom due May 14, which our subscribers have known about for the past month and so they have been anticipating its arrival. There is also a bottom due at the end of the May, which helps to illustrate the point that sometimes a bottom is what prices go down into, and sometimes it is what prices go up out of.
A big strong June and July is wholly contrary to the old saw about "Sell In May...". Most of the time that rule does work, at least in part, but in election years a whole different rule goes into effect. If the correlation persists this year as well as it has been doing up until now, we can look forward to a big rally in June before the market finally enters a plateau in July, when the media's attention is tuned to the campaign promises being slung by the presidential candidates.
So I suppose that the revised motto should really be, "Sell In May And Go Away, Except If It Is An Election Year, And Seasonality Is Running A Week Behind, In Which Case Expect A May 14 Bottom, And A Really Strong Month Of June".
As far as mottos go, that one will never catch on.
Tom McClellan
Editor, The McClellan Market Report
Feb 03, 2012
Eurodollar COT Indication Calls For Big Stock Market Top Now |
Jan 13, 2012
RASI Above +500 Says Bull Market Not Done |
Nov 05, 2010
Entering the 3rd Presidential Year |