COT Report Data on Copper Offer A Glimpse Into Economy

Free Chart In Focus email
Delivered to you every week
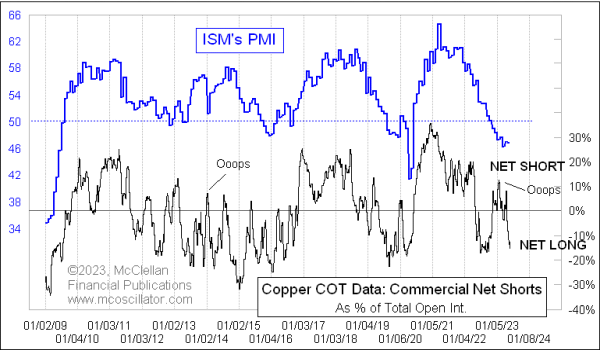
"Doctor Copper" has long been held in high repute as an economic expert, and this week's chart looks under the surface of what copper prices themselves are doing to see an interesting additional insight. The comparison in this chart involves the Institute for Supply Management's index known as PMI, which used to stand for Purchasing Managers Index. It is a diffusion index of several inputs, and offers a glimpse into manufacturing activity in the U.S. Readings above 50 show expansion, and below 50 show contraction.
Also in this chart are data on copper futures from the weekly Commitment of Traders (COT) Report, published every Friday by the CFTC. The lower plot in the chart shows the net position of the "commercial" traders of copper futures, expressed as a percentage of total open interest. The commercial traders are ones who use the subject commodity in their trade or business, so they may be copper producers or big users. Right now this group of traders is net long to a pretty large degree, which means that they think copper prices are low right now and worth locking in.
The interesting point of this week's chart is the correlation between these two data series. When the commercial traders are net short copper futures in a big way, that is a pretty good topping sign for PMI. As the economy weakens, those traders move from net short as a group to net long, and the PMI follows that path lower. The nice thing about this relationship is that the COT Report data come out weekly, whereas the monthly PMI data are released with a lag. So we can get a clue ahead of time about what the PMI data are going to look like.
Occasionally the message from the copper futures data gets it wrong, and the correlation goes astray for a short time. We saw an example of that earlier this year, when the commercial traders of copper futures jumped up to a modest net short position in January 2023, and the PMI did not match that bounce. But the two plots are back together again.
The implication of the big net long position that the commercial traders are holding now in copper futures is that we ought to see a price rebound for copper, part of a rebound for the economy, and that should eventually show up in the monthly PMI numbers.
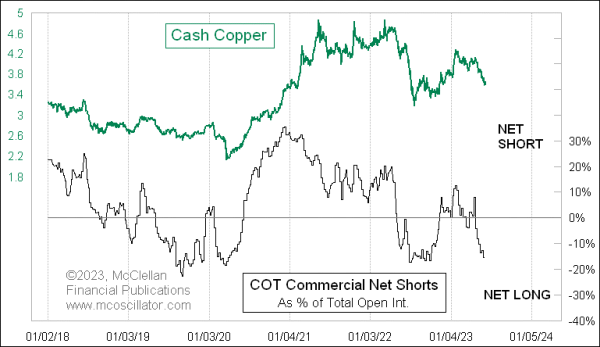
The more typical application of these COT Report data is as a direct indication of what copper prices themselves should do. Here is that comparison:

Seeing the smart-money commercial traders skewed pretty far to the net long side is a message that copper prices should be bottoming. But understand that this reflects a "condition" and it is not a "signal". Conditions like this, or like overbought/oversold, or extreme bullish or bearish sentiment, can persist for a long time before they finally decide to matter. Copper prices are not required to start upward now just because we notice this condition, but it has proven itself over time as something which matters.
Tom McClellan
Editor, The McClellan Market Report
May 18, 2023
Copper Shows Bearish Message For Stocks |
Sep 03, 2020
COT Report Data on Copper |
Jul 15, 2022
Wild Times for the Copper/Gold Ratio |