Gold COT Data Call for More of a Drop

Free Chart In Focus email
Delivered to you every week
Gold prices are seeing a Christmas week pop, getting all of the gold bugs excited again. But the smart money “commercial” traders of gold futures have a different vision of the future.
Every Friday, the Commodity Futures Trading Commission (CFTC) publishes its Commitment of Traders (COT) Report, detailing the numbers of futures contracts held by different groups of traders. They break it down into the commercial, non-commercial, and non-reportable traders. Commercial traders are ones who use the subject item of the futures contract in their trade or business; so think of Cargill or ADM for wheat futures, Goldman Sachs for T-Bonds, etc. Non-commercial traders are the large speculators (think hedge funds). And the non-reportable traders are speculators whose positions are so small that the CFTC does not figure they are worth being reported individually.
The commercial traders are generally speaking the smart-money, and when they get to a big skewed position it usually pays to bet with them, at least in the long run. So they are the ones I pay the most attention to. Every Friday when the COT Report gets released, I cover the relevant insights it has to offer for the markets I follow in my Daily Edition.
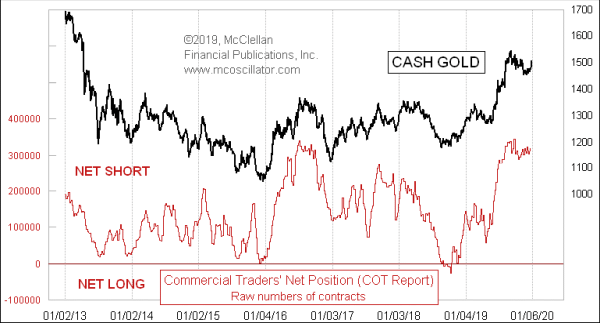
This week’s chart is one that features prominently in that lineup, especially in recent months. The commercial traders have moved collectively to a big net short position. A lot of the commercial traders in the gold futures market are gold mining companies, using the futures market to fix a price for their future production. So when they move to a big net short position as a group like this, it is a pretty strong statement that the people who are in the gold business think this is a good price at which to sell.
One important point to understand about the COT data for gold is that the commercials have long been biased to the short side. Since 2001, there has only been one time that they have actually gone to a net long position as a group, and that was in late 2018, when gold was making a pretty important bottom. The rest of the time, they have been net short to varying degrees, and so the game consists of evaluating their net position relative to their recent range. Even on that basis, their current big net short position is a pretty compelling message that gold prices are too high at the moment, and that an appropriate adjustment is coming.
The commercial traders went to this big net short position back in September 2019, when gold prices were topping out at $1540/oz. Even though gold prices have fallen since then, the commercials have not pared their big net short position. That says they really believe that gold prices have a lot further to fall.
To see this and other COT data charts, check out our Daily Edition at https://www.mcoscillator.com/market_reports/.
Tom McClellan
Editor, The McClellan Market Report
Jun 14, 2013
Gold COT Data Show Bottoming Condition |
Apr 09, 2015
Crude Oil COT Report Data |
Nov 22, 2019
Squeeze Is Building in Industrial Metals |