Market and Polling Not Following the Typical Pattern

Free Chart In Focus email
Delivered to you every week
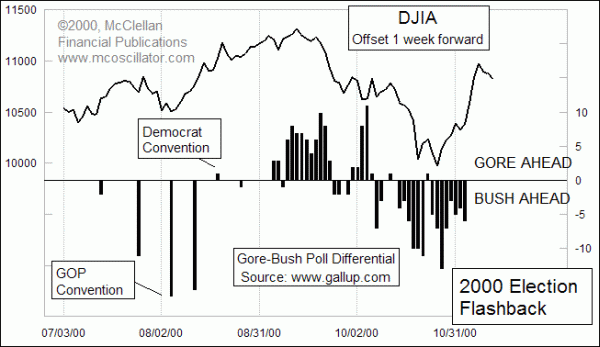
We have been tracking the interrelationship between the stock market and the presidential elections ever since 2000. That was a year when we proclaimed in our twice monthly newsletter that the election results would be "too close to call", and that was at a time when then-Gov. George W. Bush was leading Vice President Al Gore by 6 points in the polls. Indeed, that election was too close to call for a full 6 weeks following the voting.
The way we knew that the election would be closer than the polls said was due to the observation that the poll numbers seemed to be following the movements of the DJIA with a lag of about a week. So because we had seen the rally that started just before the election, we knew that the big spread in the polling that favored George W. Bush would narrow some by the time the actual voting was done.
This year is working differently from the last 3 elections, in that the polling data are not responding to the stock market's movements in the same way. Normally, a rising market will lead to a bump in the polling data for the incumbent party candidate about a week later. That's how it worked in 2000, 2004, and 2008, even though the incumbent party candidates were from different parties. The thinking behind this phenomenon is that if the public feels generally good, then stock prices will rise, and the public will also like the guy who is in the White House at that time. The lag in the reaction stems from the fact that stock prices can react immediately to changing moods, but polling data takes some time to gather, assemble, and report. So the movements of the stock market reflect the mood in real time, while the polling data reflect it with a lag.

Back in October 2000, there was a big bottom for stock prices on Oct. 18, 2000. The poll numbers reached an extreme of 13 points in favor of George W. Bush about a week later, and then the numbers started narrowing as the election drew nearer, and as the DJIA saw a robust rebound. Bush still had a 6-point lead on the Friday before the election, but the popular vote the following week was just about dead even. That led to no shortage of consternation, disagreement, name-calling, etc.

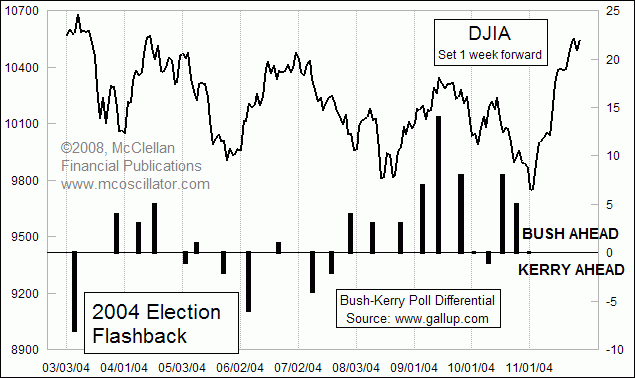
In the 2004 election between President Bush and Senator John Kerry, there was a big top for the DJIA on Sep. 7, 2004, and the polling disparity saw its echo just a week later with Bush leading Kerry by 14 points (source: www.gallup.com). But the stock market correction during the rest of September and into October 2004 was echoed by a drop in that poll spread, such that on the Friday before the election the polls showed a dead heat. In our twice monthly newsletter, we predicted a 2-3 point victory for President Bush because we had noticed the rebound in the DJIA, which was not yet reflected in the polling data.
The media in November 2004 featured multiple stories about how the pre-election polls might have "gotten it wrong" in showing a dead heat, while the actual election saw President Bush win reelection with a 2.4% margin of victory in the popular vote. The point is that the polls did not get it wrong; they accurately reflected how the public was feeling at the time the polling was done. But the polls did not take into account the last minute shift in the public's mood which was revealed by the movements of the DJIA, and which showed up as a swing toward President Bush that echoed the swing higher by the stock market.
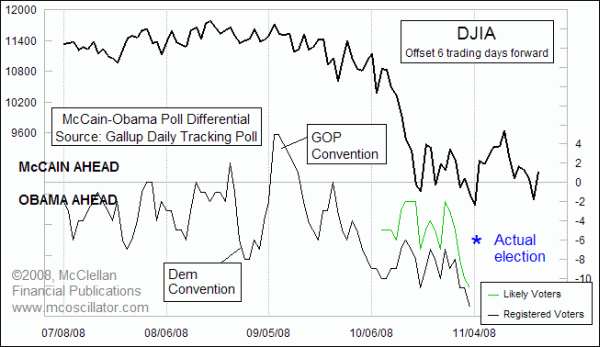
The same dynamic worked in the 2008 election, with a rise in the stock market leading to a move toward the incumbent party candidate about a week later. That year, Senator John McCain was the incumbent party candidate, even though he was not an incumbent, and so he got the benefit or detriment of rising or falling stock prices. The poll numbers peaked in favor of Senator McCain in early September 2008, as an echo of a late August peak for the DJIA.

But the financial market meltdown in September 2008 took down the stock market and the public mood so far that there was little chance of recovery for Senator McCain's prospects. The DJIA bottomed on Oct. 27, 2008 at 8175.77, and then began an impressive rally to 1000 points higher just 3 days later, and a peak at 9625.28 right on election day, Nov. 4, 2008. That rally brought about a big narrowing of the pre-election polling gap of 13 percentage points among "registered voters", and 11 points among "likely voters". The actual election result saw a popular vote differential of 7 percentage points in favor of President Obama.
Conspiracy theorists will probably spend the next 100 years wondering about what would have happened if the person holding the job of New York Fed President during the financial collapse in 2008 had been a McCain supporter, instead of President Obama's future Treasury Secretary. But that is a subject for another time.
I remember that a lot of the reporting at the time in 2008 involved analyzing the hypothesis that the public must have been lying to the pollsters, saying that they favored then-Senator Obama but voting differently in private. What these charts help us to understand is that there was not widespread lying in the poll responses; the polls just had not factored in the big swing in the public's mood that had been reflected in the big rebound in the DJIA on the days just before the election. If the election had been a few days later, then the 1450-point rebound by the DJIA might have closed the gap even further.
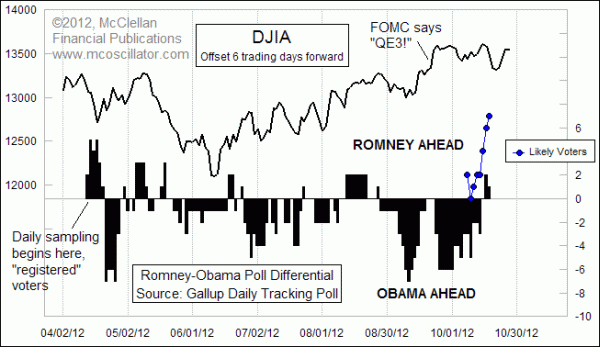
The last 3 presidential elections have pretty well established the pattern that a move up or down by the stock market will help or hurt the incumbent party candidate, with a lag time of about a week. But the 2012 poll numbers are not fitting that model, which is really interesting. The lead chart at the top of this article shows that movements upward by the DJIA tend to be followed by corresponding movements of the poll numbers in favor of Gov. Romney about 6 trading days later.
The October 2012 surge in favor of Gov. Romney is being credited to his performances in the first two presidential debates. But it just so happens to echo a similar move higher by the DJIA to a high on Oct. 5. If the pattern correlation continues to play out this way, then we should see the numbers move briefly back in favor of President Obama before moving back again in favor of Governor Romney.
One important point to understand about polling data is that polls are conducted and released much more frequently now than they used to be. That is both good and bad. It is good to have more frequent polling and get more information. But it is bad because the quality of the information may be suffering.
The cost of polling has gone down dramatically, now that telephonic robots can do it. It used to be that an actual person would make a telephone call, and ask several questions of the person answering the phone which would help to filter out misleading results. Now, the robot asks the respondent to "press 1 if you are a registered voter...." People don't like responding to robots, and so polling companies are lucky if they can get a 10% response rate. But that's okay if a battalion of phone robots can cover a wide enough swath of the public to get an acceptable amount of data.
Polls also suffer from a bias in terms of who they are able to reach by phone, and who will respond. Generation Y types tend not to own land-line phones, and so they get filtered out from the potential pool. Some respondents end up suspecting the legitimacy of polling efforts, and so they decide not to play along. For some reason, a lot of polls that have been released lately show a much bigger percentage of Democrats than has actually turned out in real elections, leading to a lot of criticism about the sampling methodology. Knowing what I know about the sampling methodology and the public's response, I am sympathetic to the pollsters' plight, but also less likely to believe literally in the reports that they release.
We are still too far away from the actual election for the stock market's leading indication to tell us anything about how the actual voting will turn out. That will be something that we will be watching and reporting on for paid subscribers. The key for those who want to play along at home will lie in watching how the market moves in the days immediately preceding the election. A big swing upward for the market at the end of October would seem to favor a Romney win, while a big swing downward would mean that the poll numbers should move about a week later in President Obama's favor.
Tom McClellan
Editor, The McClellan Market Report
Sep 08, 2012
Election Year Differences |
Apr 13, 2012
Fed and ECB Balance Sheets |
Feb 17, 2012
Fed Sloshing The Liquidity Pool |
Feb 10, 2012
Visualizing Spending and Revenue |