Ratio Adjusted Summation Index
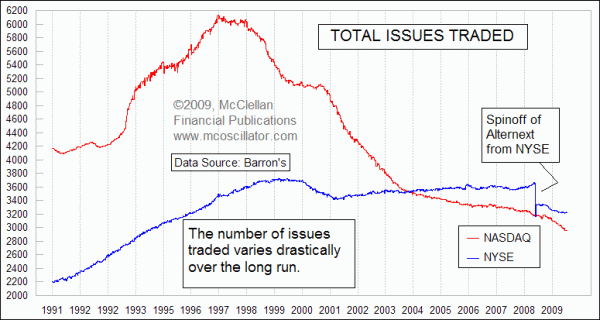
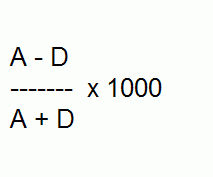
When Sherman and Marian McClellan were developing the McClellan Oscillator and Summation Index in 1969, they used 8 years of historical data. That was quite a lot of data to go through, considering that all of the calculations were done manually, and all charts were hand posted on graph paper. The market in the 1960s was fairly stable, and so they did not give any consideration to the possibility that the number of issues traded might vary in a significant way. So the McClellan Oscillator calculations were done based on raw numbers for advances minus declines. Since the 1960s, the number of issues traded has grown dramatically, and recently has also contracted. Changing the number of issues traded changes the amplitude of movements of the Oscillator, and thus the Summation Index. That creates problems for doing any sort of analysis based on the level of a Summation Index reading. In other words, it becomes hard to know how high "high" is.  Using the normal calculation methods for the McClellan Oscillator and Summation Index is still okay, as long as one accepts the need to mentally and/or graphically adjust for the changing amplitudes. A current reading of either indicator is best viewed in comparison to recent readings anyway, so changes in the total number of issues over long periods is not as important for immediate market analysis. But for long term historical analysis, a more precise method of adjustment is appropriate. The way that we adjust the Advance-Decline (A-D) numbers is to divide them by the sum of Advances plus Declines (A+D), which factors out the change in the number of issues. One could add in the number of Unchanged issues, but this number is usually very small, and it becomes one more piece of data to have to keep track of, so we do not bother. We next add one more mathematical step, which is to multiply the result by 1000. This puts the adjusted A-D number back into the realm of real numbers, instead of tiny decimals. In effect, we are adjusting the data to pretend that there are always exactly 1000 issues traded. Here is the complete adjustment formula:
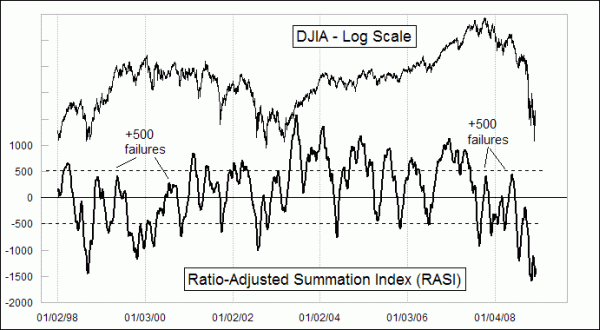
  The calculation then proceeds as normal for the 10% Trend, 5% Trend, Oscillator, and Summation Index. See Calculating the McClellan Oscillator for additional details: To differentiate these adjusted indicators from the standard ones, we refer to them as a Ratio Adjusted McClellan Oscillator (RAMO) and Ratio Adjusted Summation Index (RASI). The RASI is a particularly useful indicator for helping us identify when an uptrend is strong enough to continue past the initial up surge. We want to see the RASI go from an oversold reading, below -500, up to a nice strong reading well above +500, and the higher the better. Failing to reach the +500 level is like a rocket that fails to achieve escape velocity, and then falls back to Earth. It is a sign that an uptrend is not strong enough to continue, and that the recent price lows are likely to be revisted.