


Employment and Inflation: The Real Relationship
Free Chart In Focus email
Delivered to you every week
Economists are scratching their heads about the latest Employment Situation Report just out on August 7. Unemployment fell from 4.2% to 4.1%, but total nonfarm payrolls actually shrank by 23,000 jobs. The head scratching is not just about how those two numbers can be in the same month's jobs report, but also about what the Fed officials are going to think about it.
Like most economists, the ones at the Federal Reserve seem to think that better jobs data means more inflation, and thus they should fight that inflationary force by raising interest rates. These economists all went to expensive schools to learn about that relationship, so it must be true, right? Not so fast.
Economics is a field where the scientific method is not applied very well. The scientific method holds that one should form an hypothesis, then test that hypothesis ideally via experimentation, and then after seeing the test results one should revise the hypothesis as needed. But economics does not lend itself well to this framework, because it is really hard to do an experiment where one holds all other variables constant. So economists instead formulate a hypothesis, see if it works in Greek letter equations, write a paper about it, and then retire to the bar or the faculty lounge. Any data which conflict with the elegance of the hypothesis must be anomalous, or promulgated by someone with an agenda.
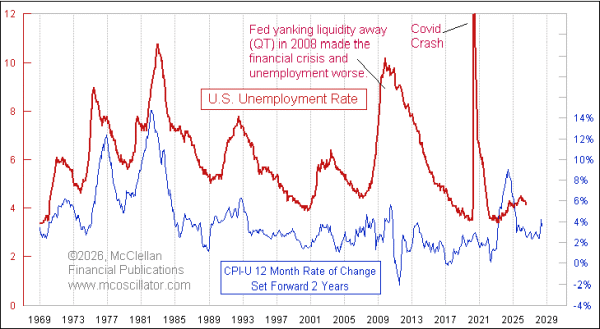
The hypothesis that strong jobs data and inflation go together is not one that survives an examination of the data, which I do in this week's chart above. It compares the annualized growth rate in CPI to the US unemployment rate (U-3). The key adjustment which unlocks a better understanding of this relationship is that I have shifted forward the CPI growth rate plot by 2 years. Doing that achieves much better alignment of the data, showing that it is not actually an inverse relationship, but a lagging one.
Saying it another way, whatever inflation is doing now is pretty much what the unemployment rate is going to be doing 2 years from now.
There admittedly are anomalous events, and Covid was the granddaddy of all anomalies. The Fed's missteps in 2007-08 also represented a thumb on the scale type event, when unemployment rose far more than what the CPI model had suggested. But the two plots got back into sync very quickly after each of those.
The decline we are seeing right now in the unemployment rate is happening right on schedule, just as the previously falling inflation rate had forecasted. When we get to 2028, we can reasonably expect a bump up in the unemployment rate, as the echo of the surge in inflation based on recent oil market movements. But that is a long way off.
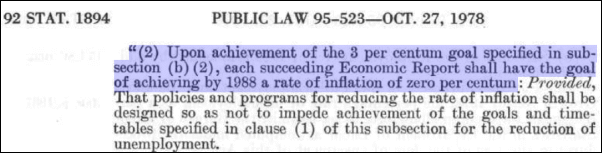
If the Fed really wanted to do its job of achieving the dual mandate of zero inflation and full employment, as mandated by Congress in the 1978 Humphrey-Hawkins Act, what they should do is somehow arrange for zero percent inflation now, and then wait 2 years for that to work on the unemployment rate. But the Fed's tools do not allow for achieving zero percent inflation. If the Fed had the tools to make that happen, they would have achieved it at some point before now. It is nearly impossible to get to zero inflation when Congress is still spending 22.3% of GDP but only taking in 16.7% of GDP. Nothing the FOMC does can make Congress balance the budget. And no self-respecting economist is going to risk the scorn of his compatriots by arguing against the conventional model that they were all taught in school, regardless of what the data say.
Tom McClellan
Editor, The McClellan Market Report
Aug 21, 2025
What the Fed Should Do, and What Lumber Says About That |
Nov 21, 2024
Sunspots: A Driver of Unemployment |
Aug 28, 2024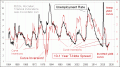
Yield Curve, Unemployment, and Sunspots |