Groundhog Day in T-Bonds

Free Chart In Focus email
Delivered to you every week
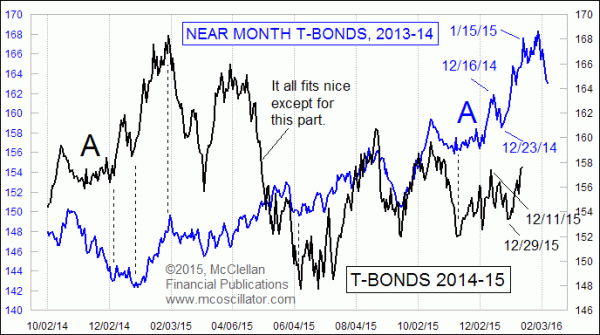
T-Bond prices are repeating the pattern of a year ago. This has been going on for a couple of years, and it persists even today.
This is important because at the end of January 2015, we saw a really important price top for T-Bonds, followed by a pretty serious decline. So if the correlation is going to continue into the future, then we have a similar prospect for February 2016 to get ready for.
The correlation has not always worked like what we are seeing now. In the middle of the chart above, we see a 2-month period when T-Bond prices dropped sharply, in contravention to what had happened in the blue line a year prior. The correlation was thoroughly broken then; but then it suddenly jumped back into correlation and has remained so ever since.
The point of this is that the correlation can break, and it will probably do so starting right when you count on it most of all to continue. For now, however, it still appears to be working.
A preliminary peak came on Jan. 15, 2015, en route to the final price high on Jan. 30, 2015. So based on last year’s script, we still have a couple more weeks to run before an equivalent final price high. If bonds stay on script, then February should be an ugly month for T-Bonds. But anyone seeking to use this model should be watchful for signs that the correlation is breaking.
Tom McClellan
Editor, The McClellan Market Report
Jan 08, 2016
Stock Market Committed to 2008 Scenario |
May 21, 2015
Crude Oil Leads Bond Yields |
Jan 09, 2015
Deficits Are Good, Sort Of |