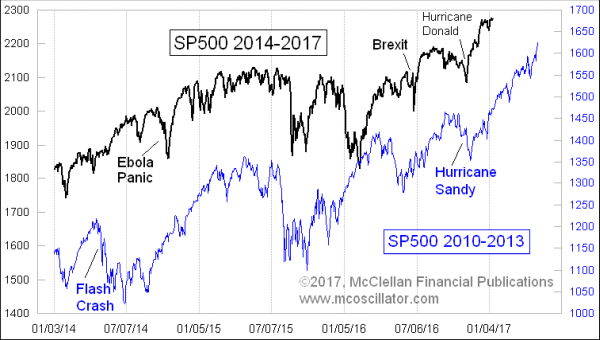
Stock Market Still Following Path of 4 Years Ago
Free Chart In Focus email
Delivered to you every week
Investors have been cheering the election of Donald Trump as the 45th U.S. president, thinking that he is going to bring a beneficial change for business, the economy, and investments. But thus far, what he has brought since the election is just a carbon copy of what happened exactly 4 years before.
I addressed this pattern correlation here a few weeks ago, as foreshadowing of what we should all expect depending on the election’s outcome. The key point to this chart is just how similar the market’s behavior has been during President Obama’s second term to what it did in the first term. The major points of disagreement between the two patterns came along from the market’s reactions to big geopolitical events, such as the shutdown of QE1 in 2010 that led to a liquidity crisis and the “Flash Crash” on May 6-7, 2010. The post-Brexit swoon in June 2016 is another example.
In each case of discontinuity between the two patterns, they got back on track after a while and ran together again. The pattern matching has even included matching dips in late December of 2016 and 2012.
Early 2013 saw the SP500 continuing to trend higher, and thus far the SP500 in 2017 appears to be following that same script. We know that it has been able to go off track with major political or Fed intervention, and perhaps inauguration of Mr. Trump will be such an event. But for now, the correlation appears to be continuing.
Tom McClellan
Editor, The McClellan Market Report
Nov 10, 2016
The Market, Under a New President |
Oct 20, 2016
The Post-Election Stock Market |
May 26, 2016
El Niño, La Niña, & The Stock Market |