A May-November Relationship

Free Chart In Focus email
Delivered to you every week
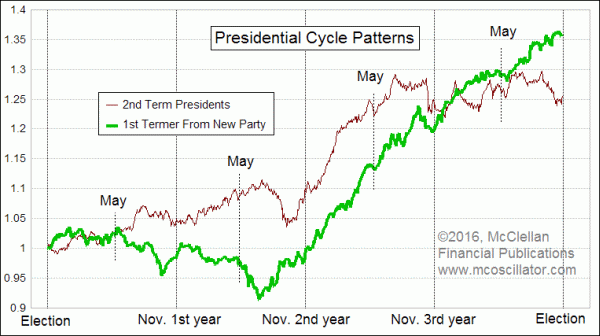
The big mantra the past two weeks is the old Wall Street saying, “Sell in May and go away”. That became an old saying for mostly good reasons. But what many do not realize is that it works differently in election years.
Where the May to November period is most reliably weak is in the first two years of a presidential term. It is even an up year during most 3rd years, except that the big crash of October 1987 pulled down the average in a big way.
During election years from 1936 to 2012, the period from May 1 to Oct. 30 has actually been up 2.7%. That’s not great, but it’s not nothing either. But we can split the data down even further (at the risk of endangering sample size) to say that it matters whether there is a first term or second term president in office.
If there is an incumbent president in office, running for reelection, then the May 1 to Oct. 31 period is up on average by 4.7%. This makes sense, because an incumbent who is running for reelection will seek to spin the news in his favor, running victory laps for all of the problems he supposedly solved over the past 3-1/2 years. Investors tend to respond well to a flood of good news, making them more optimistic about the future generally, and thus about their investments.
But if a second term president is in office, he has less motivation to go around telling everyone what a spiffy job he has been doing, since he cannot get reelected. So investors are then faced with the certainty of getting an unknown quantity as the new president, and investors hate the risk of the unknown. So during election year in a 2nd presidential term, the May 1 to Oct. 31 period averages -1.6%. In other words, “sell in May” is back on.
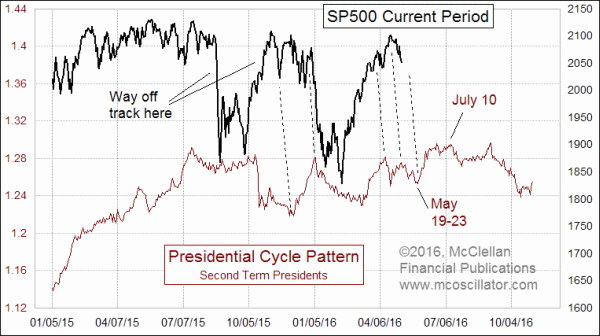
That’s not the last of it, however. May 1 is actually not the ideal time to exit in a 2nd term election year. That point is actually in June to July. Here is a chart to illustrate what I mean.

May in a 2nd term election year actually sees a bottom mid-month, and then a rally up into June and July. The final top of that rally is ideally due July 10.
The SP500 had not been following that 2nd term election year pattern very well, going wildly off track in August 2015 with the China-induced mini-crash. But over the past few months, the market seems to have gotten back on track again, albeit with the dance steps of its price patterns arriving about a week earlier than scheduled. That would mean the upcoming bottom which is ideally due around May 19-23 should appear roughly a week earlier. And it also means that we should still expect another strong up move into late June or early July before the doubts about the impending election start to become a significant negative factor.
Tom McClellan
Editor, The McClellan Market Report
Apr 07, 2016
Eurodollar COT Throws a Curveball |
Dec 11, 2015
Is this 2012, or 2008? |
Aug 28, 2015
Correctly Defining “Bear Market” |