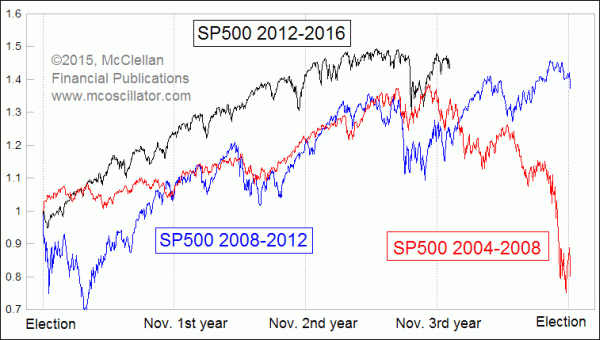
Is this 2012, or 2008?

Free Chart In Focus email
Delivered to you every week
We are now less than a year away from the next presidential election, and the stock market’s behavior during election years can be pretty variable. When a first term president is angling for reelection, he will typically try to spin the news in his favor, declaring victory for anything and everything that is happening. Investors typically respond well to hearing good news all the time, and the market goes up.
But when a 2nd term president is in office, investors have the guarantee that the next president will be new and unknown, and that makes them more nervous about investing. So election years with a 2nd term president are typically more negative than with a 1st term president.
We have seen great examples of this principle during the last 2 presidential election years. And that is the point for this week. The SP500 price action for the past 3 years has looked a lot like the 2008-2011 period. It has also looked like the 2004-07 period. And now we are at the point where those two patterns diverge from each other, and the outcome for each was a whole lot different. So it is important right now to figure which schedule the market is still on.
Robert Frost once wrote about the two roads that diverged in a wood, and how taking the road less traveled made all the difference. We might wish that we all had not traveled the road of 2008, but that is the more likely path for the stock market in 2016, given that it is a 2nd term election year.
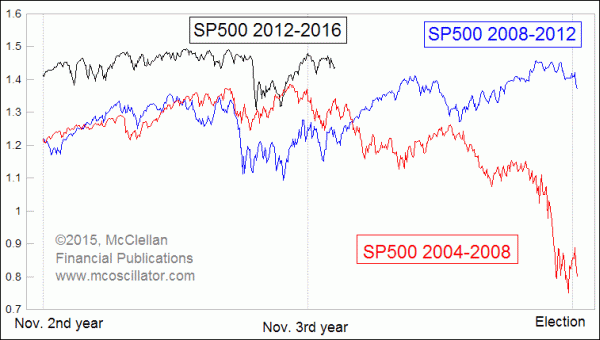
Zooming in closer, we can see that the plots of both prior patterns look very similar right up to the point where we are right now. But going forward into 2016, they show entirely different patterns.

So the market is at a decision point over which path it is going to follow going forward from here. It has arguably been following both patterns up until now, but it cannot follow both patterns in 2016.
As I survey the overall situation, I am persuaded that the market in 2016 will follow the more bearish path. Here are the main reasons:
1. 2016 is a second term election year, and so investors will have to grapple with the certainty of an unknown new president.
2. We have already seen a RASI +500 failure for both the A-D and Volume RASIs, indicating that liquidity is weak.
3. The eurodollar COT leading indication calls for a down move into April 2016, and it does not show a final bottom until October 2016.
4. US federal tax receipts have already gone above the 18% threshold, which promises a recession.
5. The spread between German 10-year “bunds” and 10-year T-Notes has already turned down from a high level.
6. High-yield corporate bonds have been extremely weak, which usually leads to illiquidity that bites the stock market.
Tom McClellan
Editor, The McClellan Market Report
Sep 17, 2015
Misplaced Optimism on Housing |
Nov 26, 2015
Debt vs. Equity |
Aug 28, 2015
Correctly Defining “Bear Market” |
Aug 21, 2015
Eurodollar COT Says Ugly Drop Is Still Ahead of Us |