

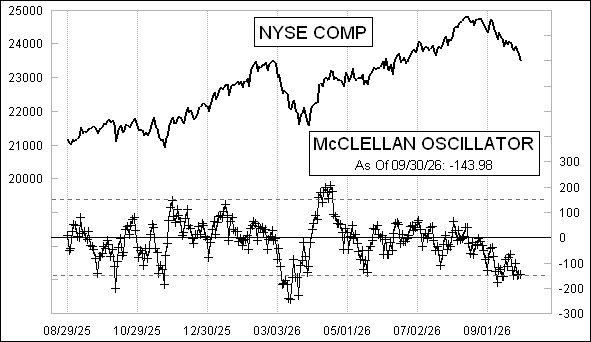
NYSE McClellan Oscillator
RASI Shows Depth of Correction
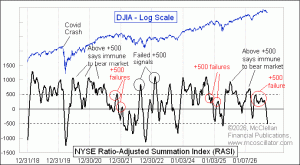
The Ratio-Adjusted Summation Index (RASI) for the NYSE is down to -522 and still falling. This is low enough to mark a decent end point for an ordinary market correction. Yes, it can go lower than this, especially in a determined bear market. But a low reading like this in a long term uptrend is a nice thing to see.
When my parents first created the McClellan Oscillator in 1969, they were initially looking at just the individual exponential moving averages (EMAs) of the daily... Read More
NYSE: 09/30/2026
| Issues | Volume(000s) | ||
| Advances | 1018 | 2060470 | |
|---|---|---|---|
| Declines | 1628 | 2200784 | |
| Difference | -610 | -140314 | |
| 10% Trend | -471 | . 868 | -748382 |
| 5% Trend | -327 | . 890 | -497573 |
| McC OSC | -143 | . 978 | -250809 |
| PRIOR McC OSC | -143 | . 478 | -299569 |
| SUMM Index | -983 | . 097 | -2718451 |
| PRIOR SUMM Index | -839 | . 119 | -2467642 |
| A-D for OSC UNCH | -616 | -999 * | |
| A-D for OSC=0 | 2264 | 4017 * | |
| *million shares | |||
| DJIA Close | 50906.05 | ||
| PRIOR Close | 51349.92 | ||
| DJIA CHG | -443.87 | ||
| DOW Price OSC | -347.59 | ||
| PRIOR DOW Price OSC | -305.78 | ||
| Price OSC UNCH'D | 51586.15 | ||
 Daily Oscillator Data (.xls)
Extended Data
All of this data, plus a lot more, is available on our Daily Edition along with charts and analysis. See our Market Reports page to get the bigger picture.
Historical Data
Historical breadth, volume, and NH-NL data are available for purchase and download.
Market Breadth Data Notes
- We use WSJ/Barron's data for our final breadth numbers. Calculations made on numbers from other sources will show a slightly different result.
- We wait until late in the day in order to have access to the "final" numbers.
- This reflects final readings for the indicators covered.
- Values for indicators calculated using preliminary numbers released just after the close usually differ slightly from these numbers.
- We usually recommend that readers keep their own data for themselves, but this is a useful way to check and see if your numbers agree with ours.
Starting 3/8/2012:
NYSE Up Volume & Down Volume data will report composite trading volume.
3/7/2012 and before:
Reports NYSE floor trading volume, as has been our long standing practice.