The McClellan Oscillator & Summation Index
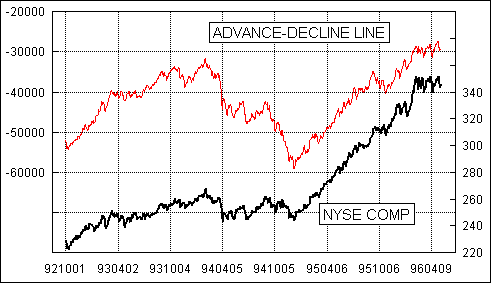
Every day that stocks are traded, financial publications list the number of stocks that closed higher (advances) and that closed lower (declines). The difference between these numbers is called the daily breadth. The running cumulative total of daily breadth is known as the Daily Advance-Decline Line. It is important because it shows great correlation to the movements of the stock market, and because it gives us another way to quantify the movements of the market other than looking at the price levels of indices.

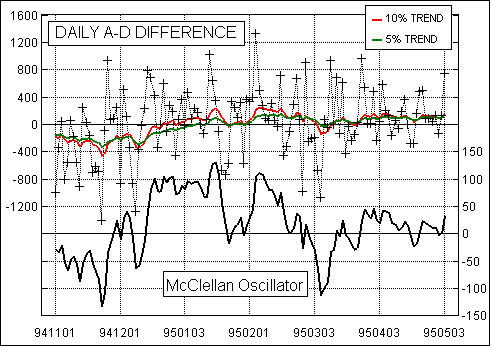
The second chart shows an example of the daily breadth. Each tick mark represents one day’s reading of advances minus declines. In order to better identify the trend that is taking place in the daily breadth, we smooth the data by using a special type of calculation known as an exponential moving average (EMA). It works by weighting the most recent data more heavily, and older data progressively less. The amount of weighting given to the more recent data is known as the smoothing constant.

We use two different EMAs: one with a 10% smoothing constant, and one with a 5% smoothing constant. These are known as the 10% Trend and 5% Trend for brevity according to the tradition established by the late P.N. Haurlan who first used EMAs for tracking the stock market in the 1960s. The numerical difference between these two EMAs is the value of the McClellan Oscillator.
The McClellan Oscillator offers many types of structures for interpretation, but there are two main ones. First, when the Oscillator is positive, it generally portrays money coming into the market; conversely, when it is negative, it reflects money leaving the market. Second, when the Oscillator reaches extreme readings, it can reflect an overbought or oversold condition.
While these two characteristics are very important, they merely scratch the surface of what interpreting the Oscillator can reveal about the stock market. Many more important structures are outlined in the book Patterns For Profit by Sherman and Marian McClellan, available from McClellan Financial Publications.
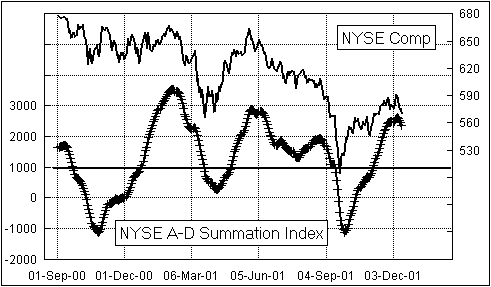
By adding up all of the daily values of the McClellan Oscillator, one can produce an indicator known as the McClellan Summation Index. It is the basis for intermediate and long term interpretation of the stock market’s direction and power. When properly calculated and calibrated, it is neutral at the +1000 level.
The +1000 neutral level was instituted back in the days of manual calculations, because some users had trouble with keeping track of the minus signs when subtracting a negative number from another negative number. Because the McClellan Summation Index in the 1960s generally moved between 0 and +2000, Sherman and Marian shifted the neutral level to 1000 to make a negative reading a rare and thus important indication. The expansion in the number of issues traded on the NYSE has caused these overbought and oversold thresholds to also expand. One of the techniques that we have implemented to deal with this is to use a “Ratio adjusted Summation Index (RASI)” calculation,

As with the Oscillator, the Summation Index offers many different pieces of information in order to interpret the market’s action. One should not just pay attention to the numerical value of the McClellan Summation Index, because understanding its chart structure offers so much more insight.
Current values for the McClellan Oscillator and McClellan Summation Index are available daily on our Data page. In every issue of The McClellan Market Report, we discuss the current market action and the interpretive significance of the McClellan Oscillator and Summation Index. See our Market Reports section to learn more about our publications.