How NOT To Use Indicators
Several subscribers recently forwarded to us a link to a web article claiming that the McClellan Oscillator and Summation Index do not work. Unfortunately, the author of the article did not spend time learning what these indicators measure, nor how to use them.
Instead, he uses misguided statistics to make a misguided assertion:
"In summary, evidence from simple tests on available data generally does not support a belief that the McClellan Oscillator or the McClellan Summation Index usefully predict stock returns at either fixed or signaled future horizons."
Here is what he did: The author combined the values for the McClellan Oscillator and for the SP500's 5-day future return into a correlation analysis. And he also looked at the SP500's 3-month future return for any given value of the Summation Index.
Now here is what he did wrong:
First, he used raw values of the McClellan Oscillator and Summation Index for an 18-year study period. When doing long term data comparisons, it is best to use "ratio adjusted" versions of these indicators, to factor out changes in the number of issues traded.
Second, he disregarded everything else except the daily numerical values of the Oscillator and Summation Index. Looking at the indicators this way throws away nearly all of the useful information that each indicator offers. The number does not matter nearly as much as what the indicator values have been doing in the recent past, which can best be determined by looking at a chart. That's why Sherman and Marian McClellan titled their book, PATTERNS For Profit, not "Numerical Values For Profit".
Third, he used this single flawed query to assert that the McClellan Oscillator and Summation Index are not useful, instead of checking into the methods that others have already used to demonstrate that they are useful.
We will say this for him: he hides his flawed analysis behind a seemingly sophisticated set of charts and statistical terms.
To get an idea of why his methodology is so flawed, consider the following chart of the McClellan Summation Index. We have highlighted a couple of different instances of when the Summation Index was at a reading of +3000.
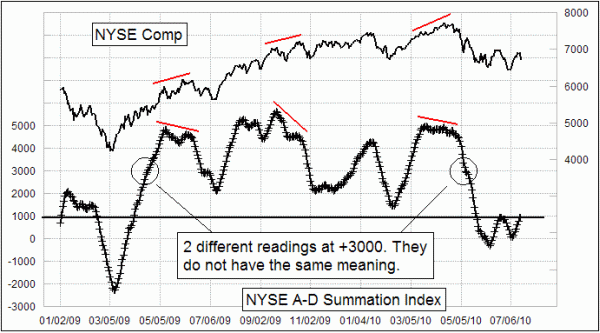
The one at the left end of the chart occurred when the market was just coming up out of an oversold bottom, and was rising strongly as part of a new uptrend. The Summation Index was passing up through +3000 en route to even higher values, and the strong breadth numbers were signaling the commencement of a healthy new uptrend. At the right end of the chart, the Summation Index was FALLING through the +3000 level after having made a divergent top relative to prices.
Each of these two similar Summation Index readings arrived with a context that is completely different the other, and that is the essential key. There is no reasonable basis for expecting that these two readings would have the same meaning, just because of passing through the same number. So constructing a complex statistical test to demonstrate that they do not mean the same thing for the direction of the market is no great revelation. One does not need a statistical test to see this.
Similarly, this next chart makes the same point for the McClellan Oscillator. Highlighted in this chart are a couple of different instances when the Oscillator happened to be at around -50.0
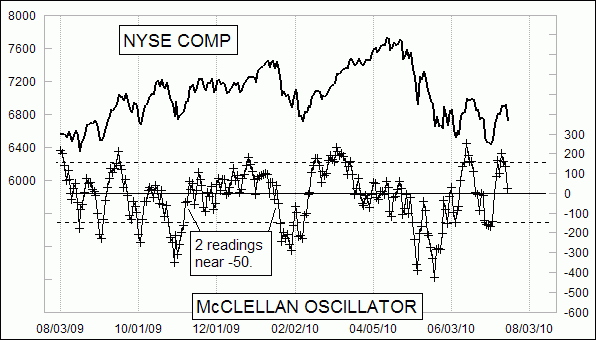
In the left-hand case, the Oscillator was rising up from a deeply oversold reading, complete with a divergence at the final price bottom. At the right hand example, the Oscillator was falling down through zero, and posting a lower low, after having made a divergent top relative to prices.
No chartist would ever think that these two data points should have the same story to tell about the market's direction, so constructing a statistical proof offers no useful insight.
Trying to forecast the market based on a single day's Oscillator or Summation Index reading is like trying to understand a single day's candlestick chart pattern all by itself, without knowing the context in which it arises. No competent practitioner of technical analysis would ever do this, so constructing a test that way reveals more about the inadequacy of the author than the indicator.
As an aside, the author of that article is also partly wrong in stating that, "The value of the McClellan Summation Index depends on the calculation start date." If one uses the same set of raw data but has two different start points for the calculations of the 10% and 5% Trend (the difference between which is the McClellan Oscillator), then it is true that the initial values of all derivative indicators for the new calculations will initially disagree with a those from a longer-established set of calculations. But over time the two sets of calculations will come into agreement with each other. For more about this topic, see our July 16, 2010 Chart In Focus article.
Tom McClellan and Sherman McClellan