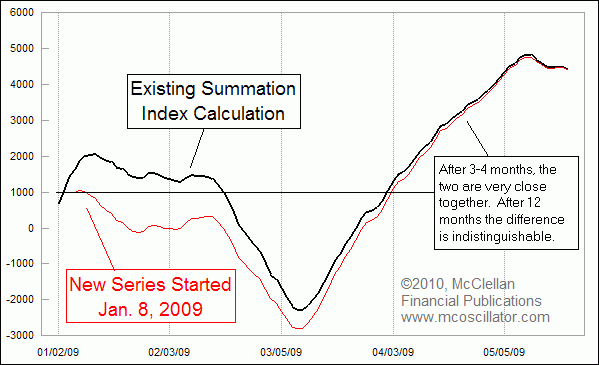
Start Point for Summation Index Does Not Matter

Free Chart In Focus email
Delivered to you every week
There are a lot of myths and half-truths about the McClellan Oscillator and Summation Index that are promulgated by others, people who have not spent as much time as we have studying these indicators. One myth is that the Oscillator is overbought at +100 and oversold at -100. That was somewhat true two or three decades ago, when the number of issues traded was much smaller, but even then it was not a useful bit of analysis to summarize a complex indication in such a simplistic way. There is much more information to be gained from these indicators than just an overbought or oversold indication.
Another common misconception is that when calculating the Summation Index, two people can get different values even when using the same raw Advance-Decline data if they start their calculations at different points in time. This is actually not true. Two people can get different values from each other if they use different raw data, or if they make calculation errors. But if the math is done correctly, then a new set of Summation Index calculations will gradually approach agreement with the values from an older set of calculations.
This week's chart illustrates this principle graphically. For this demonstration, I started a brand new set of calculations for the Oscillator and Summation Index on January 8, 2009. The Summation Index on that day was at +1877 and heading upward. For the first few weeks of the new calculation, the new version of the Summation Index moved up and down with the older one, but at different levels. Slowly the two came together, and four months later they were very close together.
A year later, the difference between the old and new versions had been completely eliminated. This can be seen below in a screenshot of an Excel spreadsheet containing this set of calculations. .gif)
I have divided this spreadsheet into an upper and lower sets of rows. The top half shows rows 1-16, and the lower half shows the same table starting at row 128. This allows us to see that 6 months after starting the new Summation Index calculation the old and new series have Summation Index values that are very close together. You can examine the data in this spreadsheet yourself if you like, just to see it up close for yourself.
The key for getting identical results from calculations started at different points in time lies in using proper starting values. Set the initial values for the 10% Trend and 5% Trend at zero, and set the initial Summation Index value at +1000. The +1000 neutral level is a leftover artifact of the days in the early 1970s when all calculations were done manually, and some people had trouble dealing with subtracting a negative number and keeping all of the +/- signs straight. Sherman and Marian McClellan had noticed that the Summation Index back then had a normal amplitude of around 2000 points, so they moved the neutral level up from zero to +1000 so as to make a negative value of the Summation Index much more rare. Values below zero indicated more serious bearish market behavior, and that is still the case despite the expansion in issues.
Nowadays, computers don't have the same troubles as humans in terms of dealing with double negatives, but we keep the old +1000 neutral convention to avoid confusion. For our Ratio-Adjusted Summation Index, we use zero as the neutral level.
By setting the start values in this way, what happens is that for the first few days of the new calculation the 10% Trend and 5% Trend will disagree with the established numbers, and so will the Summation Index. They will all be "wrong" together. But over time, the 10% Trend and 5% Trend will adjust because they are tracking the same newer data as the established set of calculations. The 10% Trend values will reach agreement sooner, because it is a faster moving average. And the Summation Index will adjust with them over time.
The key point to understand is that when using any indicator, one must get the math right first, and only then can one proceed to get the interpretation right.
Tom McClellan
Editor, The McClellan Market Report
Nov 20, 2009
NDX A-D Oscillator |
May 07, 2010 What It Takes To Get The Oscillator To Zero |
Jun 18, 2010 All Time Record Low McClellan Oscillator |