NDX A-D Oscillator

Free Chart In Focus email
Delivered to you every week
When people refer to "The McClellan Oscillator", there is an inherent understanding that this refers to the original indicator based on NYSE Advance-Decline data. That is still the indicator we use more than any other breadth oscillator, but it can sometimes pay to also look at other permutations of this same analytical technique.
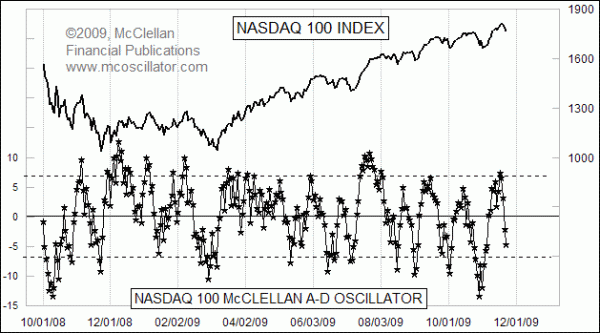
This week's chart looks at a McClellan A-D Oscillator that is calculated on the A-D numbers for the stocks which make up the Nasdaq 100 Index. These are the biggest non-financial stocks in terms of market capitalization that are traded on the Nasdaq, and the list is rebalanced each December. While these 100 stocks are just a small fraction of the 2800+ issues typically traded on the Nasdaq, they typically account for 40% of the share volume traded on that market.
Because the number of stocks in this 100 stock sample is much smaller, we need to adjust our parameters for judging the amplitude of its McClellan Oscillator. The NYSE's McClellan Oscillator (shown on our Home page) typically shows an extended condition at +/-150, with the current number of issues traded. The Ratio-Adjusted McClellan Oscillator (RAMO) for the NYSE does the same at around +/-50.
For the Nasdaq 100's McClellan A-D Oscillator, +/-7 marks overbought or oversold territory. It can go well beyond those levels, but a reading at or just beyond those thresholds marks a decent indication of an extended condition.
This was relevant recently because earlier in November the NYSE's McClellan Oscillator popped up above zero but only climbed to a reading of +104. That does not really indicate an overbought condition when its overbought threshold is more like +150. But the McClellan Oscillator for the Nasdaq 100 did show an overbought condition, indicating that the up move was likely already to an extended point even though the NYSE version did not show it.
We publish the values for the Nasdaq 100's McClellan A-D Oscillator each day in our Daily Edition, along with its companion Summation Index. We also publish the values for the NYSE and Nasdaq Composite McClellan Oscillators, both for A-D and Up-Down Volume, as well as Price Oscillators for the major indices and some other interesting indicators that only we provide. Download a free sample issues of our reports, no signup required.
Tom McClellan
Editor, The McClellan Market Report
Jan 29, 2010 Unusual Stochastic Makes Good Oscillator |
Dec 04, 2009 How Gold Forms Tops |
Jan 01, 2010 Nasdaq A-D Line “Divergence” |
Oct 16, 2009 A-D Line Has the Story on Corporate Profits |