Why You Should Fear A Balanced Budget
Free Chart In Focus email
Delivered to you every week
For the fiscal year that ended in September, the US government's total federal debt grew by $1.88 trillion to $11.9 trillion. For perspective, that total debt equates to $38,663 per person for every man, woman, and child currently living in the U.S., and it does not include unfunded liabilities like future Medicare and pension payments. Running up a huge debt like this is terrible for anyone who has grandchildren, and has to contemplate leaving that debt to them to pay off. But having the government increase the size of the debt is a wonderful thing for investors while it is happening.
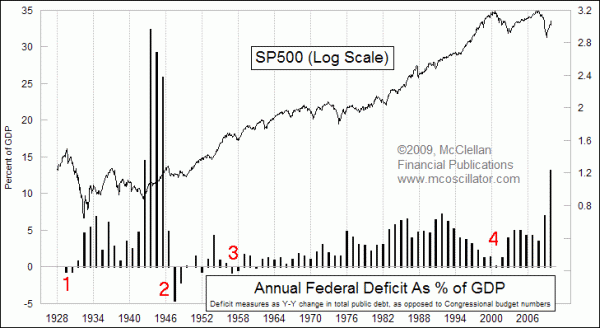
This week's chart looks at the annual change in the total federal debt, expressed as a percentage of total GDP. Last year's bar is the biggest we have seen since World War II, and that deficit spending is one big reason why the stock market has been able to rebound from the March 2009 low. Generally speaking, it is quite stimulative to the stock market for Uncle Sam to run up the debt. Instances when the debt has shrunk have invariably led to problems for the stock market.
The federal government ran a budget surplus in both 1928 and 1929 (point #1 in the chart). That helped contribute to the illiquidity conditions behind the big stock market decline from 1929-32, although there were plenty of other causes for that decline as well.
Big deficit spending during Roosevelt's first term helped to push the stock market up from 1933-37. Then the movement back towards a nearly balanced budget in 1937-38 ushered in a decline which erased most of the stock market's gains from the mid-1930s.
Big deficit spending to support the war effort in the early 1940s pushed the stock market up at a rapid angle of ascent. But then the efforts to pay off all of those War Bonds in 1947-48 (point 2 in the chart) kept a lid on the stock market's growth.
Point 3 marks the surpluses seen in 1957-58 under President Eisenhower, and the stock market responded by moving sideways for 2 years after what had been a really nice advance under big deficits earlier in the decade.
During the 1960s through the 1980s, the federal government pretty consistently ran budget deficits and increased the size of the debt each year, helping to fuel a huge economic expansion and a great bull market. But notice that starting at point 4, the size of debt growth got very small, and the 2000-2002 bear market ensued. Getting back to bigger deficits starting in 2002 helped to fuel the rebound.
So as we think about the current market, and the current state of growth in the federal debt, it seems pretty clear that the big increase in debt during 2009 has been a good thing for the stock market. It has assuredly not been a good thing when viewed from other perspectives, but as investors we should not lose sight of the reality of how the world works. For so long as the government is going to increase the size of its debt, that should be a good time to be a stock market investor. The problem for investors will come at the point when the government finally does what it arguably needs to do, and starts to pay off that debt.![]()
Tom McClellan
Editor, The McClellan Market Report