How Gold Forms Tops

Free Chart In Focus email
Delivered to you every week
It is not well understood by many people that different markets have different personalities. The way that prices behave is not uniform from one market to the next, owing to the particulars of how each market works, and the motivations of the people who trade them. A great example of this is in the way that gold prices form tops and bottoms.
The stock market usually makes rounded tops and spike bottoms. The reason is that the complacency that is prevalent at stock market tops brings about quiet trading, while the panic of a dramatic selloff to a climax bottom makes a sharp bottom, followed by a steep rebound as money starts rushing back in.
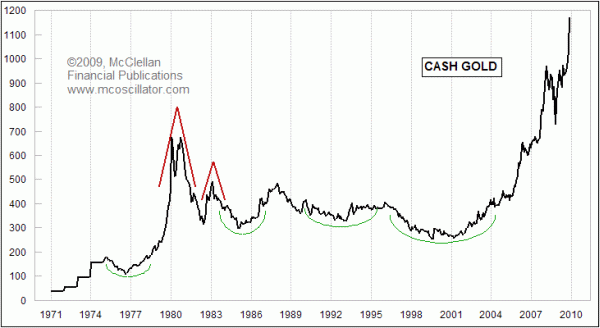
For gold, those same motivations work in reverse. People panic out of stocks; they panic into gold. For that reason, gold typically makes spike tops, like the one we saw this week. Bottoms tend to be more rounded, and declines in gold prices usually do not end on big down days.
The mid 1970s saw a lengthy rounded bottom in gold prices, following the opening of free trading in gold among U.S. investors. That rounded bottom led to a huge blowoff top in 1980. The multiyear bottoms of the 1980s and 1990s were also rounded, both on the monthly time frame shown in the chart above, and on shorter term time frames.
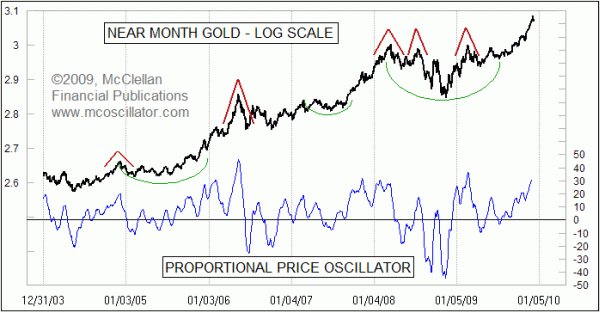
The daily basis chart below shows the same phenomenon on the shorter time scale. Price tops tend to be blowoffs, while the bottoms that lead to big uptrends are more rounded. A rounded bottom serves the function of causing traders to lose interest, and give up on the game. That is useful because then those same traders can get lured back after the breakout move, providing fuel for the uptrend.

Over the past few weeks, gold has had a big run from $950 to over $1200. It appears that we have seen the spike top for this section of the move, and that gold should be expected to correct downward at a slope equivalent to the slope of the up move. The Proportional Price Oscillator is up to a high enough level to merit a top of significance. The correction out of this top should continue until that Price Oscillator gets down much closer to zero, or even down through it.
Tom McClellan
Editor, The McClellan Market Report
Nov 20, 2009 NDX A-D Oscillator |
Jan 08, 2010 The One Real Fundamental Factor Driving Gold Prices |
Jan 29, 2010 Unusual Stochastic Makes Good Oscillator |