Gold Sentiment Washout

Free Chart In Focus email
Delivered to you every week
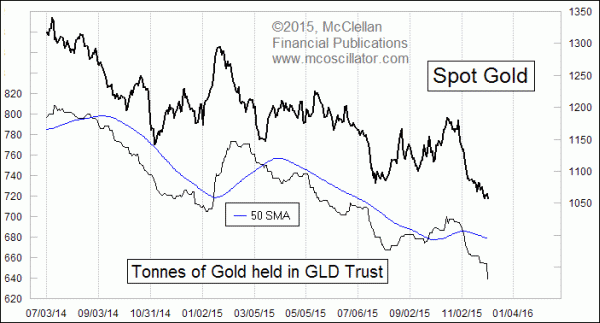
Gold traders seem to be losing all hope and giving up. That is the message from the drop in total assets invested in GLD, the largest of the gold bullion ETFs.
The total assets in that fund go up and down as more investors or fewer decide to be invested in it. The sponsoring firm, State Street, issues or redeems shares as needed to keep the share price as close as possible to the net asset value. If they issue more shares, then they take that money and go into the gold bullion market to buy more ounces of gold. And when investors want to get out of GLD, the sponsoring firm sells ounces of gold and uses that money to redeem shares. This is generally the same process that most ETFs use; the difference is that the assets are ounces of gold instead of shares of stock.
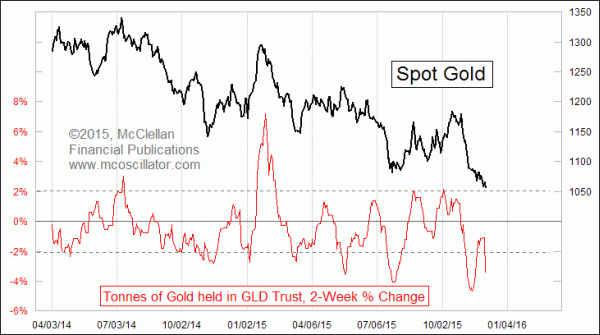
Wednesday, Dec. 2, saw a one-day drop of 2.4% in the number of tonnes of gold held by the GLD Trust. That is a huge one-day move, and in my view is a sign of capitulation. Normally I like to look at the raw assets as in the chart above, and also the 2-week rate of change (%ROC), as shown in this next chart:

Generally speaking, when this indicator goes outside +/-2%, it marks a turning point for gold prices. Just a couple of weeks ago it got all the way down to -4.6% as the gold price selloff was reaching a point of exhaustion. That did not mark a price bottom though, and now we are seeing a further washout by traders fleeing GLD.
This matches the message I am seeing in the Commitment of Traders (COT) Report data for gold futures, something I have discussed recently in both our twice-monthly McClellan Market Report newsletter and our Daily Edition. The smart-money commercial traders were in a big net short position at the top in October, but have been rapidly covering their shorts as this recent decline has unfolded, and now they are better positioned for a rebound. So as the hot-money traders have been fleeing GLD (and gold futures too), the big-money and usually smart-money commercial traders are taking the other side of that trade. That says gold should see a rebound very soon.
Tom McClellan
Editor, The McClellan Market Report
Oct 30, 2015
COT Data For Gold At Topworthy Level |
Dec 02, 2011
Gold ETF Assets Show Bullish Sentiment |
Dec 06, 2013
Gold COT Data Again Proclaiming a Price Bottom |