


Crude Oil and Yields Diverging
Free Chart In Focus email
Delivered to you every week
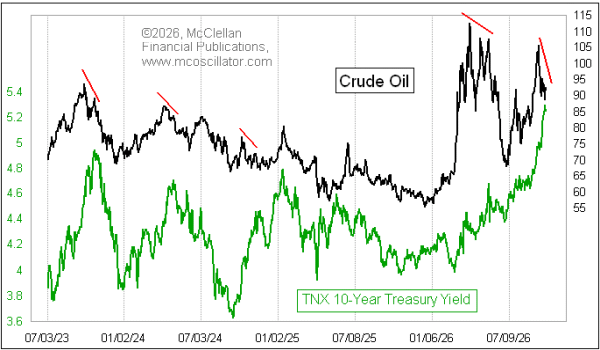
Crude oil prices have been in an amazingly strong positive correlation with bond yields for a few decades. But it is not a perfect correlation, and there can be information in the subtle differences.
It makes sense that oil prices and bond yields should move together. Higher oil prices mean higher prices generally, and inflation is the enemy of any fixed income product, stealing away the value of the future payments. So it is not a surprise to see them moving together.
What is noteworthy right now is that oil prices are not echoing the recent up move during September 2026 in the 10-year T-Note yield. Oil prices peaked on Sep. 15 and fell more than $16 from that high. But the 10-year yield kept on rising during the last half of September, creating the divergence we see at the right end of the chart above.
History shows that divergences like this are a regular feature of important tops for bond yields. They don't happen every time, but it is often enough to pay attention, especially when their message is so compelling.
The drop in oil prices means that we should see a corresponding drop in bond yields to catch up (i.e. down) with what oil prices are already doing. How oil knows better what is coming for bond yields is a fascinating question, but not an essential one. We can see from history what these divergences mean, even if we might not necessarily know how to explain what causes them. Chasing the "why" is far less important than noticing the "is".
Tom McClellan
Editor, The McClellan Market Report
Oct 23, 2025
Inflection Point for Crude Oil |
Aug 20, 2026
Bessent Does Not Know He’s Battling Against the Gold Market |
Aug 28, 2024
Yield Curve, Unemployment, and Sunspots |