


RASI Shows Depth of Correction
Free Chart In Focus email
Delivered to you every week
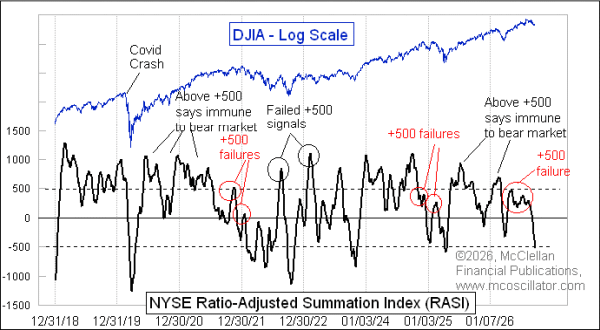
The Ratio-Adjusted Summation Index (RASI) for the NYSE is down to -522 and still falling. This is low enough to mark a decent end point for an ordinary market correction. Yes, it can go lower than this, especially in a determined bear market. But a low reading like this in a long term uptrend is a nice thing to see.
When my parents first created the McClellan Oscillator in 1969, they were initially looking at just the individual exponential moving averages (EMAs) of the daily Advance-Decline difference. The first key insight was to look at the adjacent columns of the (manual!) calculations of these EMAs in the ledger, and to wonder about the difference between the EMAs. That idea led to the McClellan Oscillator, and the same idea was also used a couple of decades later by Gerald Appel when he created his Moving Average Convergence/Divergence (MACD) indicator.
The second key insight was to look at McClellan Oscillator values on a cumulative basis. My mother Marian was a math major in college, and so she knew about the principle of "integrating the area under the curve" from calculus. This led to the McClellan Summation Index, which is an ongoing running sum of previous McClellan Oscillator values. That means it changes each day by the value of the Oscillator.
Another innovation came along in the 1990s, when we created the Ratio-Adjusted Summation Index (RASI). It factors out changes in the numbers of issues traded, solving the problem of increasing amplitudes back then from the big growth in the number of NYSE issues traded. Using the RASI allows us to better evaluate long term historical values and tendencies, and to make better comparisons of how far is "far" in a big movement.
That is the essential question we face now with the RASI down to below -500. I pay a lot of attention to the ability of the RASI to climb up to well above +500 during an advance, as a way to know if the up move has enough energy to achieve escape velocity. Failing to climb above +500, as we just recently saw this summer, is a sign of weakness and an invitation to see prices make a meaningful drop.
Negative values work differently, though. Getting down to a nice deep negative value is a sign that the selloff has done some important work, and at least an attempt to rebound is likely. An upturn by the RASI from such a deep negative reading is a great sign of a new price upturn. Getting that signal requires the McClellan Oscillator to go back above zero.
When the RASI turns up, the classic version of the McClellan Summation Index will turn up at the same time. A good bullish move can take the RASI from current levels to above the +500 level in a single run. Failure of the RASI to make it back above +500 would identify possible problems with the price advance. Keep in mind that the classic McClellan Summation Index goes up and down through its +1000 neutral level at the same time as the RASI goes up and down through zero. When the RASI reaches +500, the classic Summation Index can have different numerical values depending on how many issues are trading at that time.
You can see a chart of the McClellan Oscillator every day at https://www.mcoscillator.com/market_breadth_data/, and also see the daily values for the A-D difference that would be required to get the Oscillator back to the zero level. You can also read about the math involved in calculating the RASI at https://www.mcoscillator.com/learning_center/kb/market_data/ratio_adjusted_summation_index/.
Tom McClellan
Editor, The McClellan Market Report
Jul 16, 2026
RASI +500 Failures Thus Far Unfulfilled |
Jul 10, 2026
McClellan Oscillator Quietest in Years |
Nov 26, 2021
RASI Failed At +500, Bad News For Bulls |