Gold COT Data Show Bottoming Condition

Free Chart In Focus email
Delivered to you every week
Commercial traders of gold futures are showing one of the most bullish conditions in years. They are usually presumed to be the "smart money", and so when commercial traders move to a lopsided net position as a group, it usually means that prices are going to be moving in their chosen direction.
The CFTC releases its Commitment of Traders (COT) Report on Fridays, with data reflecting positions held as of the preceding Tuesday. Licensed futures brokers are required to submit the positions held by their customers. For larger traders, the CFTC wants to know by name who is holding what, and those traders are broken down into two categories: commercial traders are the really big ones, and get classified as such if they are commercially "...engaged in business activities hedged by the use of the futures or option markets." Non-commercial traders generally hold smaller positions but are still above the threshold for individual reporting. Those whose positions sizes are so small as to not be worth reporting individually are categorized as "non-reportable". Read more on these definitions at the CFTC's web site.
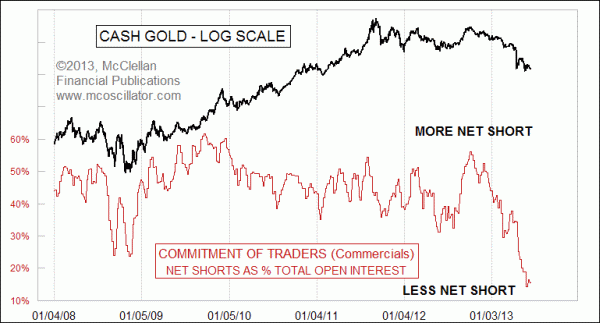
We cover the relevant details of the COT data for selected futures markets every Friday in our Daily Edition. One item that has merited particular attention recently is the hugely skewed position in precious metals futures. This week's chart shows commercial gold futures traders at an extremely low net short position, and the situation in silver is similar.
In recent years, commercial gold futures traders have been continuously net short ever since late 2001, and so the game consists of evaluating their comparative net short position relative to recent readings.
The reason for this bias to the short side is that a lot of the commercial gold traders are gold producers, who sell their future production ahead of time in the futures markets, and who thus are short. Commercial traders of silver futures have been continuously net short to varying degrees going all the way back to the start of modern COT Report data back in 1986.
In the chart above, the current reading is the commercials' lowest net short position (as a percentage of total open interest) since 2001, which was when gold prices were just starting a multi-year uptrend from below $300/oz. The message here is that commercial traders as a group are convinced that gold prices are heading higher. They usually get proven right, eventually, although sometimes we have to wait around longer than we might wish for "eventually" to get here.
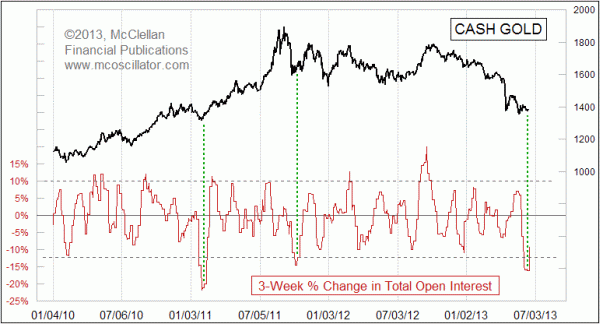
One other way I like to use the data in the COT Report for an interesting insight is to watch total open interest numbers. One insight that I recently shared with our Daily Edition subscribers is that when the 3-week rate of change of total open interest drops below around -12%, it is usually a pretty good indication of an important bottom for gold prices.

Whether or not this recent sudden drop in open interest is going to lead to a real and lasting uptrend for gold prices, or instead just bring a temporary pop, is something that this indicator does not tell us. But history says that it should be associated with a meaningful price bottom, which tells me that we should get some meaningful amount of a price rally from here.
Tom McClellan
Editor, The McClellan Market Report
May 24, 2013
Gold Coins Can Bring a Message |
Aug 17, 2012
Taking a Look at COT Data For The Euro |
Mar 09, 2012
Gold ETF Investors Were Not Scared Away |