Nikkei-Nasdaq Analog Update
Free Chart In Focus email
Delivered to you every week
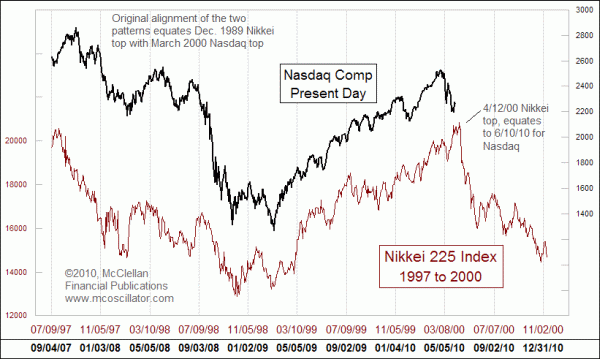
Back in September 2009, we looked at the history of an interesting price pattern analog that showed how the current Nasdaq Composite Index is retracing the price patterns seen 10 years earlier in the Nikkei 225 Index. You can review the September 18 CIF article HERE.
Since the publication of that article, the Nasdaq Comp continued its advance pretty much right on schedule according to the Nikkei's old pattern, even making minor dips and peaks in step with that pattern seen 10 years prior. It is a pretty amazing point to consider that something which happened 10 years prior in another country could be repeated with this degree of precision a decade later.
If the Nasdaq Comp were to do a perfect repeat of the Nikkei's pattern, involving the time offset portrayed in this chart, then we should see a higher high on June 10. But expecting such exacting precision would be asking more of this technique than is reasonable. Events do come along that can skew the correlation temporarily, even as the larger pattern still remains intact, and the big swoon we have just seen on Greek debt worries is a great example of this point.
We also need to understand that such price pattern analogs do not persist forever. Stock prices can fall into a pattern that has been seen before, either in the pattern of the same index or in that of some other market such as the Nikkei. But eventually the correlation breaks up and does not work any more. That is something we will assuredly have to face at some point with this analog, and indeed the breakup may already be happening.
The seeming conflict between the behavior of the Nasdaq and the pattern seen earlier in the Nikkei has only recently popped up as a problem. Prior to the second leg down in the Nasdaq, the correlation was working really well, even including the dip brought about by the May 6-7 "Flash-Crash". So is this a permanent break in correlation, or only a minor deviation? Is the pattern inverting? These are points that we will not know until a few more weeks go by.
If the correlation is indeed still intact, then the big worry lies in what the Nikkei pattern has to say about this summer. It shows a steep decline, similar to the message it had about the trend for the Nasdaq in late 2007 and 2008.
Tom McClellan
Editor, The McClellan Market Report
Sep 18, 2009
Old Nikkei 225 Chart Pattern Has Story To Tell For Today |
Apr 16, 2010
Presidential Cycle Shows April Top |
Jul 17, 2009
Panics We Have Seen Before |
Jan 15, 2010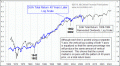
Stock Market Repeating the Sideways 70s |