


Sunspots and the Yield Curve
Free Chart In Focus email
Delivered to you every week
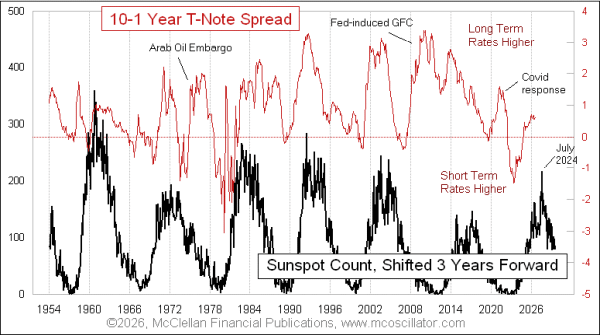
The yield curve has been steepening ever since its maximum point of "inversion" back in June 2023. That is good news for the economy that the yield curve is steepening, as that serves as a healthy sign for GDP. The term "steepening" refers to yields at the long term end of the maturity spectrum being higher than short term yields. So steepening can occur by raising long term rates, lowering short term ones, or some combination of the two.
A climax point for this steepening trend is due in the summer of 2027, according to this week's chart. It reveals how changes in the monthly sunspot number tend to get echoed about 3 years later in the path of the 10y-1y yield spread. It is important to note that the plot of monthly sunspot numbers is shifted forward by 3 years in this chart, to achieve a better alignment to the interest rate data.
The entire yield curve contains multiple data points at any given time, reflecting rates all across the spectrum from 1 month to 30 years, so it is hard to portray the entire yield curve. I am using the spread between 10-year and 1-year Treasury yields as a proxy for the whole yield curve.
This leading indication relationship is not perfect, and occasionally a big geopolitical event will arise which throws the correlation off track. The Arab Oil Embargo in 1973-74 was a great example of this principle, as was the Covid pandemic reaction. And we had a "Global Financial Crisis (GFC)" in 2008 because of the Fed overstimulating the housing bubble, then trying to get that toothpaste back into the tube. Sunspots did not tell us about those events.
But as soon as an event like those winds down, the relationship gets back to working again as it is supposed to. The June 2023 point of maximum yield curve inversion was 3 years after the 2020 sunspot minimum.
The peak for this current sunspot cycle was in July 2024, so counting 3 years forward gets us to a projected peak for the 10y-1y spread due in July 2027. It does not always work out to 3.00 years and the exact calendar month, but the relationship is pretty close. After summer 2027, we should expect a flattening of the yield curve, meaning that short term rates and long term rates should start to get closer together.
Tom McClellan
Editor, The McClellan Market Report
Aug 28, 2024
Yield Curve, Unemployment, and Sunspots |
Nov 21, 2024
Sunspots: A Driver of Unemployment |
Feb 26, 2026
Sunspot Cycle Says Unemployment to Continue Rising |