VIX Below 12!
Free Chart In Focus email
Delivered to you every week
The CBOE Volatility Index (VIX) has dropped below 12. Below 12!!! Surely this must be one of the signs of the apocalypse.
Not so fast. A low VIX is a sign of option trader complacency, and complacency is a problematic sign for the market which can lead to a price decline. But when the VIX gets really REALLY low, the message changes. Sure, it is a sign of an absence of worry, and a correction is possible. But the really big price tops do not appear when the VIX is this low.
In 2000, the SP500 topped after the VIX had climbed up from the really low levels of a few years earlier. The final price top came when the VIX was at 16.54.
In 2007, the SP500 again topped with the VIX above 16. It had been much lower earlier that year, bottoming below 12 in April 2007 well in advance of the final price high. This is a consistent theme.
When a toy top spins, it is at its most stable point when the RPM are high enough to maintain stability. Gradually the friction against the tip spinning on the floor slows the top, and the top starts to wobble. The wobbling is a prelude to the top falling over completely. In other words, instability increases ahead of the tipping point. When everything is as stable as it can be, that is not yet the tipping point. So while a VIX reading below 12 is a quite spectacular condition, history says it is not the sign of an ultimate price top.
On a shorter term time scale, the VIX can give us a hint of a brief change in trend direction. It is normal for the VIX to make a lower low as the SP500 makes a higher high. But when there is a disagreement, THAT is when we get useful information from the VIX. We have a tiny little divergence right now, with the VIX making higher postings at the same time when the SP500 is also making higher highs. On a short term basis, this is a sign of the spinning top starting to wobble, and sets up the opportunity for a countertrend price drop.
The divergence is a setup for potential trouble. The real trouble for short term price movements typically comes when the VIX rises up above its 50-day moving average (50MA). That is a topic I addressed here.
But we should not confuse a short term setup for a corrective move with the signs of a more important long term top. Seeing the VIX go this low is NOT the sort of condition consistent with the major tops of the past.
Tom McClellan
Editor, The McClellan Market Report
Jul 23, 2010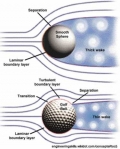
Golf Balls, Geese, and the VIX |
Sep 10, 2010
Year-End VIX Plunge Coming |
Jan 02, 2014
VIX ETN Not Right For Investors |