Year-End VIX Plunge Coming

Free Chart In Focus email
Delivered to you every week
The rapid plunge in short term interest rates almost two years ago is finally about to matter for stock prices.
One of the least understood aspects of Federal Reserve policy on interest rates is that there is a big lag time between their implementation and when the effect is seen in the economy. It takes a while between the time a seed is planted and when it finally starts to grow into a plant.
Stock market volatility has been slowly coming down, and this is evident in the falling values for the CBOE Volatility Index (VIX). A falling level for the VIX is generally associated with rising stock prices, and vice versa. The illiquidity which leads to falling stock prices also drives up market volatility, as prices have to wander farther and faster to get to levels where liquidity can be found.
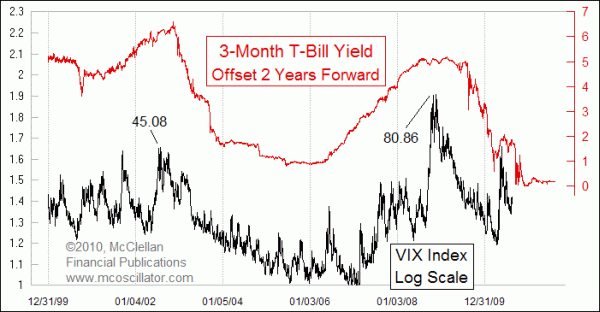
The really cool aspect about the VIX's movements is that we can model them 2 years in advance by looking at what short term interest rates are doing. This week's chart compares 3-month T-Bill yields to the VIX, and the trick is that the interest rate plot is shifted forward by two years.
This charting technique of shifting one plot forward to see its leading indication for another is a principle we call Liquidity Waves. It can be extraordinarily useful if one can identify two sets of data which share a lead-lag relationship.
The collapse of Lehman Brothers and other stock market problems led to the 3-month T-Bill yield falling close to zero beginning in September 2008. Now two years later, we are about to experience the echo of that interest rate drop in the form of a VIX drop in the 4th quarter of 2010.
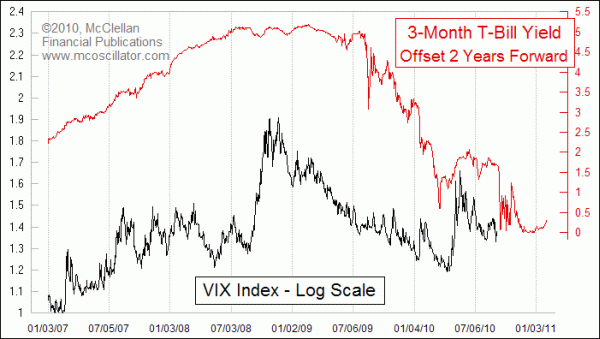
The chart below looks at the same relationship, but zooms in closer to see the immediate forecast in greater detail.

The wild choppiness of interest rates in late 2008 implies that we will see some big movements in the VIX between now and November 2010. But by the end of the year, this leading indication says that the VIX should be calmed down, and at lower levels than the low 20s we are seeing right now. The implication of this is that the stock market should rise in concert with a VIX drop into December and beyond. That idea fits nicely with the impending upturn for the stock market being forecasted by the Presidential Cycle Pattern, something which we discussed in the April 16 Chart In Focus, and which we recently updated for our paid newsletter subscribers.
To learn more about our premium products and see sample issues, click HERE.
Tom McClellan
Editor, The McClellan Market Report
May 23, 2010
Spike up in VIX Was On Schedule |
Oct 09, 2009
VIX Headed Much Lower in 2010 |
Apr 16, 2010
Presidential Cycle Shows April Top |