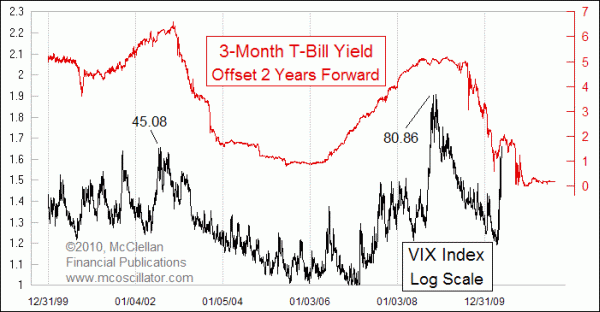
Spike up in VIX Was On Schedule

Free Chart In Focus email
Delivered to you every week
Congress and the SEC are still in the process of trying to figure out why the May 6 Flash-Crash happened. But one aspect of that event that is not a mystery (at least to us) is WHEN it happened.
The movements of the VIX echo the movements of 3-month T-Bill yields, with about a 2-year lag time. It is not a perfect relationship, in part because the VIX is a lot noisier than T-Bills are. But in terms of identifying the general trend and when it is likely to change direction, the T-Bill yield does a pretty good job.
Back in 2007, the Fed started dropping interest rates rapidly, in an effort to avoid a recession from the collapse of the housing bubble. By March 2008, the 3-month T-Bill yield had dropped all the way to below 1%, but began rebounding to above 2% by June 2008 as economic indications started to look like the Fed's efforts were working.
Shifting forward by 2 years, that bump up in interest rates had its echo as a bump up in the VIX, brought about by the scary Flash-Crash selloff.
As we all know now, the belief that the economy had been saved in early 2008 turned out not to be correct, and the Fed had to push interest rates all the way down to near zero. That means the VIX should get all the way down to single digits a couple of years afterward, which equates to sometime this autumn. And having the 3-month T-Bill yield stay so low for so long suggests that the VIX is going to remain at low levels until such time as the Fed finally decides to start raising interest rates again.
Tom McClellan
Editor, The McClellan Market Report
Oct 09, 2009
VIX Headed Much Lower in 2010 |
Feb 05, 2010
The Volatility of Volatility |