New Rising Star Stock Program

Free Chart In Focus email
Delivered to you every week
When most people think of "breadth" indicators, they think about Advances minus Declines (A-D), and all of the permutations of indicators based on it like the A-D Line, McClellan Oscillator, etc. But one can also think of breadth in terms of looking at other properties of what individual stocks are doing. These include counting the number of stocks which are above some moving average, the number making new highs or new lows, the percentage on point and figure buy signals, and others of greater complexity.
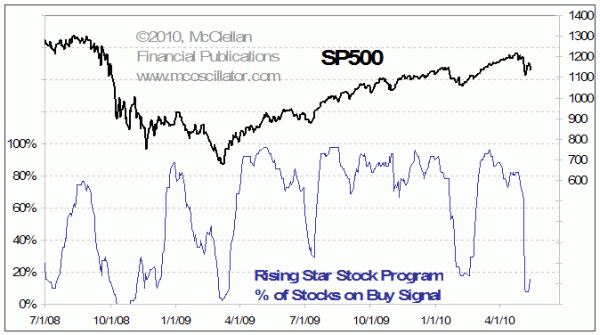
This week's chart features a brand new indicator, which comes from a new money management program that we have helped to develop at Global Investment Solutions. The Rising Star Stock Program involves investing in individual stocks which are part of a pre-selected pool of higher beta stocks. The program buys and sells stocks among this group depending upon individual buy or sell signals generated by each stock itself. The trigger for each trade involves an indicator that falls into the category of "directional" analysis. The exact parameters are proprietary at this point.
The indicator in this chart reflects the percentage of the stocks in the pool which are on a buy signal at any given time. Right now, that percentage has fallen to a very low level. You can look back and see that past instances of very low readings on this indicator have been associated with important price lows for the SP500.
The way that this managed accounts program is designed, portfolios will lighten up on their overall exposure to the market as more stocks generate "sell" signals. So in a downtrend, the program will automatically move to a lower equity exposure. As each stock begins its own rebound, the portfolios will scale back into a larger exposure.
The idea is that during upward trends in the market, catching the higher beta stocks as they begin their moves upward will bring greater than market returns. And during market downtrends, portfolio drawdowns will be minimized by rotating out of each stock as it generates a sell signal.
Below is a chart of the hypothetical performance in a portfolio that would have followed these signals since the end of 2007. This does not reflect actual performance, since this program has only been trading live since December 1, 2009..gif)
As always, neither past actual performance nor hypothetical performance is a guarantee of actual results. You can find out more about the design of this program, its actual performance, and whether it might be appropriate for you, by contacting Roger Kliminski of Global Investment Solutions at (949) 660-7960, or roger@globalinvestsolutions.com. You can also read more about it at our Rising Star FAQ page.
Readers of our Daily Edition can follow this program's buy and sell signals every day starting on Friday, May 14. You can see a sample of the program's stock picks & results which is our newest addition to the Daily Edition.
Right now, the very low reading on the chart of the percentage of stocks on a buy signal suggests that the market is near an important low, and that the upside potential for the major averages outweighs the risk of continued downward movement. How long that upside potential persists is another topic, and it is one that we will address for our paid subscribers in both our twice monthly McClellan Market Report and our Daily Edition.
Tom McClellan
Editor, The McClellan Market Report
May 07, 2010
What It Takes To Get The Oscillator To Zero |
Apr 30, 2010
Lumber Prices Show Good News for Jobs |
Apr 23, 2010
Home Prices and the Birth Rate |
Apr 16, 2010
Presidential Cycle Shows April Top |