Weak Housing Data Conceals Real Inflation

Free Chart In Focus email
Delivered to you every week
I'll bet you did not know that housing makes up 42% of the Consumer Price Index (CPI). All the rest of it, food, energy, clothing, recreation, education, transportation, toys, cosmetics, etc. makes up the other 58%. So whatever housing prices are doing has a big effect on the headline CPI number.
The softness of housing prices continues to artificially supress the growth of the CPI inflation rate. Some Fed officials are even saying that they need to strive for higher inflation to help the economy rebound, in spite of the Fed's mandate to promote "stable prices".
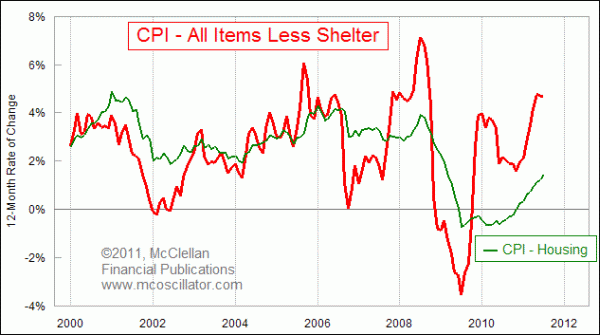
Most people have heard about the CPI variant that excludes food and energy. But not many people outside the economics community know that the Bureau of Labor Statistics also publishes a long list of alternate permutations of CPI calculations, including or excluding various components. This week's chart shows a comparison of the CPI-Housing growth rate versus "all items less shelter", which is that other 58% of the CPI calculation I mentioned above. When we exclude the contribution of the housing price data, we can see that the inflation rate for everything else is already up to 4.68%.
And this high inflation rate is occurring at a time when the yield on the 30-year T-Bond is just 3.51%, and 10-year T-Notes are yielding just 2.15%!
The chart also reveals that the CPI-Housing growth rate is already working on catching up to where the inflation rate has gone for everything else. And if the next chart is correct, the future should bring even higher housing costs.

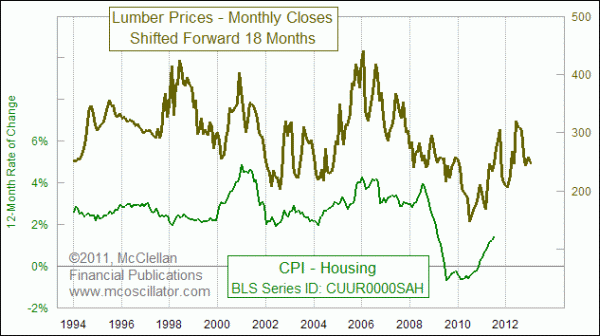
This chart shows that the CPI-Housing growth rate follows the movements of lumber prices, with a lag time of about 18 months. So the bottom for housing prices in 2010 was just the echo of the bottom in lumber prices in early 2009. The current uptrend for the growth rate of CPI-Housing is following the path of an up move in lumber prices that occurred 18 months before. Lumber prices peaked in December 2010, which suggests that the CPI-Housing numbers should continue rising until around June 2012.
If so, that is going to take away the depressing effects of low housing prices on the headline CPI data. And a higher input from housing prices joining with the already 4%+ inflation everywhere else is going to make it really hard for the Fed to live up to its promise to keep interest rates low until 2013.
Tom McClellan
Editor, The McClellan Market Report
May 06, 2011
Gold Foretold The Commodities Dip |
Apr 08, 2011
Bernanke Should Listen To Gold |
Dec 31, 2010
Lumber Prices Call For Housing Stocks Rally |