


Dallas Fed Survey Has a Pearl of an Index
Free Chart In Focus email
Delivered to you every week
Different Fed districts are known for making different contributions to economics. The Atlanta Fed famously runs its GDPNow forecast. The St. Louis Fed runs the FRED database of economic data. And the Dallas Fed has some really interesting data in its monthly survey. It can be accessed at https://www.dallasfed.org/research/surveys/tmos/data.
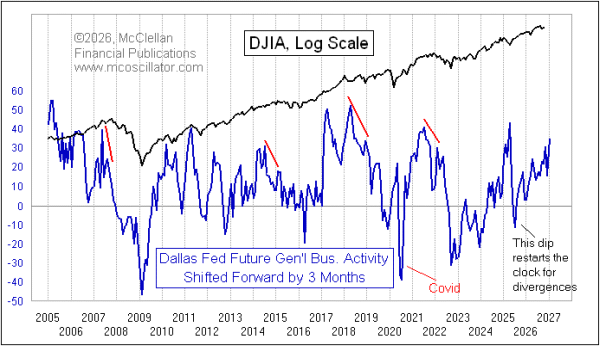
That link takes you to a page with an option to view the "unadjusted" index data, which has 33 different columns of economic data, enough to keep an economist happy playing with it for a long time. I find that one series in particular stands out as being useful for my purposes, and it is shown in this week's chart. The index of Future General Business Activity is nice because it correlates very strongly with the stock market. But more importantly, that correlation comes after applying a 3-month adjustment. In other words, that index gives us a 3-month leading indication for what stock price changes are going to look like.
That is meaningful right now because the latest data for October 2026 show this index still rising. It is an interesting feature of this relationship that important price tops tend to arise when there is a divergent lower top in this Future General Business Activity Index. Right now there is no divergence.
Divergences can be great indications, telling us about trouble coming, and we all want to know about that. But a divergence in any indicator is what I call "a condition, not a signal", and it does not tell you exactly when it is going to matter.
A non-divergence can be even better, because it says there is no indication of a big important top coming, at least during the next 3 months. Some future divergence might develop, someday, but for now the message is that stock prices should be expected to go higher.
One important note about divergences is that they must be read correctly. In early 2025, this index posted a very high spike, which I attribute to business leaders' optimism about all of the great things that were assuredly coming their way under the new Trump administration. That optimism quickly turned negative with the announcements of all the tariffs in April 2025. All of the index values since then have been lower than that early 2025 peak, but these lower values do not constitute a divergence in my view. This is because that dip to a negative reading in this index resets the clock for measuring any divergence. A proper divergence needs to appear between this index and prices without such a dip to a negative reading.
For now the message is that the uptrend in the stock market should continue.
Tom McClellan
Editor, The McClellan Market Report
Dec 30, 2015
Dallas Fed’s Signs of Recession |
May 22, 2026
Retiring Boomers Broke This Economic Relationship |
Aug 05, 2021
Taxes Too Darned High, Retarding The Economy |